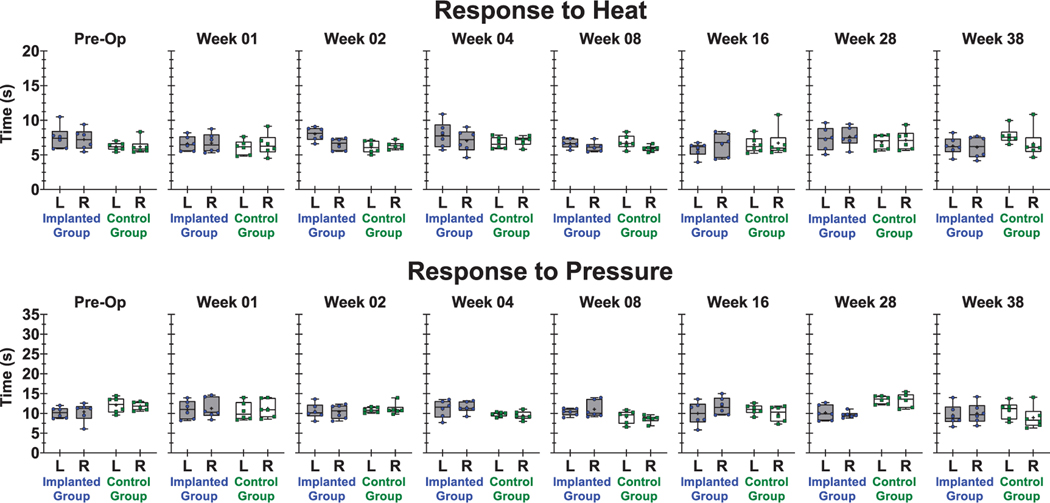
Figure 5.
Time to paw withdrawal in response to sensory stimuli for selected time points pre-op and post-op weeks 1, 2, 4, 8, 16, 28, and 38. (Top) Response to heat and (bottom) response to pressure, where data points within the box plots represent each animal in the implanted group or control group and the mean of n = 6 animals is indicated by the (+) symbol. Data within each group are separated by rear left (L) or rear right (R) paw.

