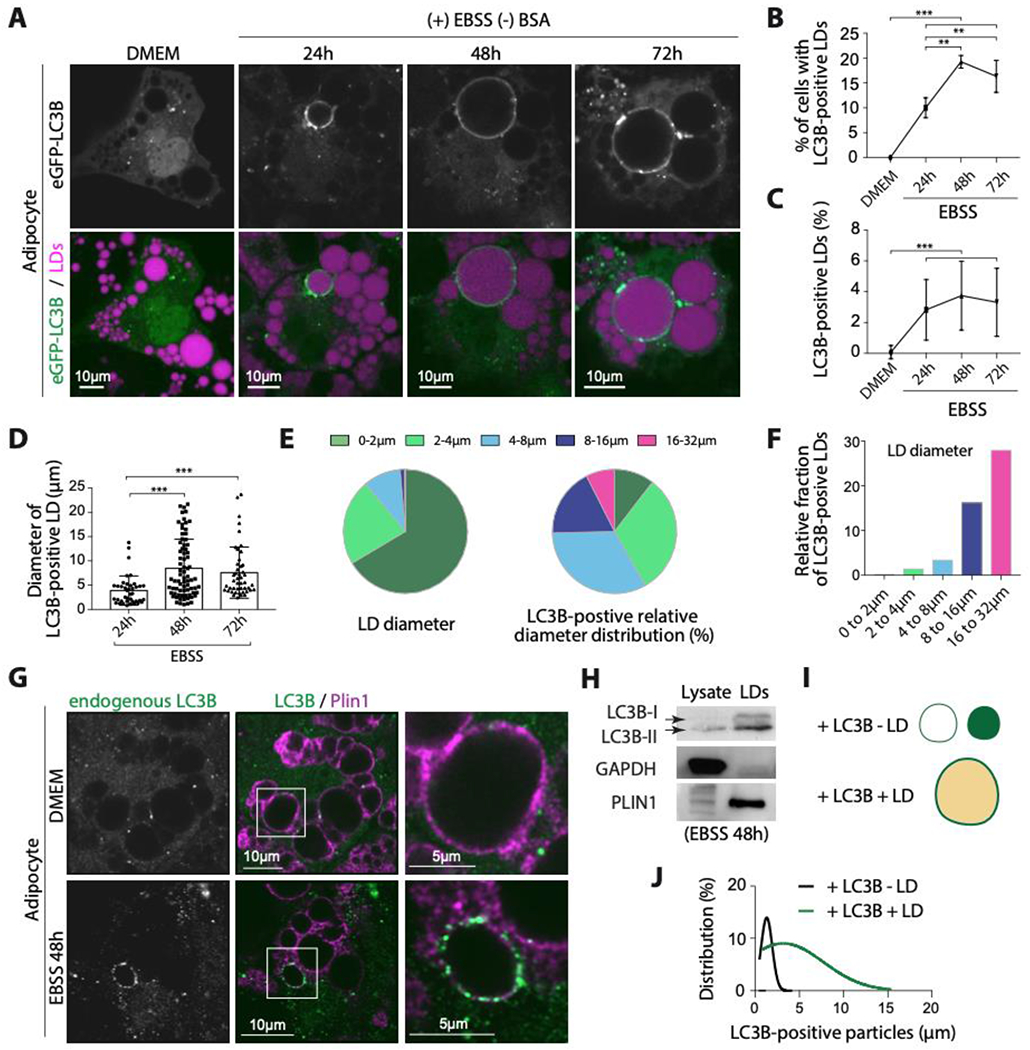
Figure 1. LC3B is recruited to LDs during long-term nutrient deprivation.

A. Confocal imaging of eGFP-LC3B and LDs in differentiated 3T3-L1 adipocytes virally transfected with eGFP-LC3B. Cells were incubated in EBSS for the indicated time after transfection. Scale bar, 10 μm.
B. Percentage of cells with eGFP-LC3B-positive LDs. Data were obtained from three independent experiments done as described in A. An ordinary one-way ANOVA test was used (** P < 0.001, *** P<0.0001).
C. Percentage of eGFP-LC3B-positive LDs per cell. Data were obtained from three independent experiments done as described in A. An ordinary one-way ANOVA test was used (*** P<0.0001).
D. Diameter of eGFP-LC3B-positive LDs quantified from three independent experiments done as described in A. An ordinary one-way ANOVA test was used (*** P<0.0001).
E. Left: sector graph shows the size distribution of LDs in differentiated 3T3-L1 adipocytes, transfected with eGFP-LC3B and incubated in EBSS for 48hs. Three independent experiments n=10 cells were collapsed. The right sector graph shows the size distribution of eGFP-LC3B-positive LDs. Quantifications are from 4 independent experiments.
F. The relative fraction of eGFP-LC3B-positive LDs in a size range (i.e. per size distribution, normalization of E).
G. Immunofluorescence staining of LC3B and PLIN1 in differentiated 3T3-L1 adipocytes incubated in EBSS for 48hs.
H. Western blot of lysate and LDs fractions of cells treated as described in G.
I. Schematic representation of LC3B puncta with or without LD.
J. eGFP-LC3B puncta size distribution with or without LDs. The data were obtained from 10 cells from three independent experiments.
See also Figure S1.
