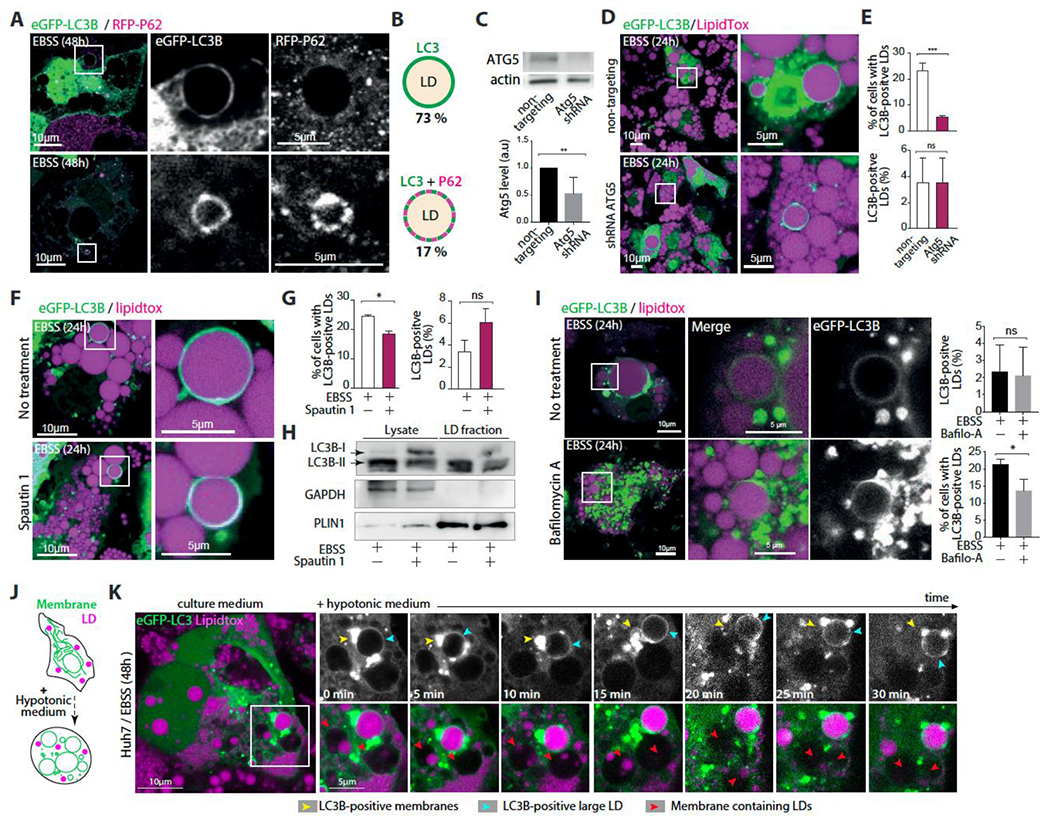
Figure 2. LC3B is not recruited to LDs by known factors.

A. Confocal imaging of eGFP-LC3B, mRFP-P62 and LDs in differentiated 3T3-L1 adipocytes. Cells were virally transfected with eGFP-LC3B and mRFP-P62 and incubated in EBSS for 48hs. Scale bar,10 μm (5 μm in insets).
B. Schematic representation illustrating the recruitment of eGFP-LC3B alone or with mRFP-P62 on LDs. The percentage of LDs of each phenotype is written below the corresponding schematic representation. Quantifications are the average from three independent experiments.
C. Top: western blot of differentiated 3T3-L1 adipocytes virally co-transfected with eGFP-LC3B and with either ATG5 shRNA or non-targeting shRNA for 24h, and then incubated in EBSS for 24h. Bottom: quantification of ATG5 expression from three independent experiments Student’s unpaired t-test is used (**P<0,001).
D. Confocal imaging of LDs in differentiated 3T3-L1 adipocytes treated as described in C. Scale bar,10 μm (5 μm in insets).
E. Top: Percentage of cells with eGFP-LC3B-positive LDs. Bottom, Percentage of eGFP-LC3B-positive LDs per cell. Quantifications are from three independent experiments. Student’s unpaired t-test is used (***P<0,0001, ns P>0,05)
F. Confocal imaging of eGFP-LC3B and LDs in differentiated 3T3-L1 adipocytes virally transfected with eGFP-LC3B and incubated in EBSS alone or EBSS containing Spautin-1 for 48hs. Scale bar,10 μm (5 μm in insets).
G. Left, percentage of cells with eGFP-LC3B-positive LDs. Right, Percentage of eGFP-LC3B-positive LDs in the cell. Quantifications are from three independent experiments done as described in F. Student’s unpaired t-test is used (**P<0,001, ns P>0,05).
H. Western blot of lysate and LD fractions of differentiated adipocytes incubated in EBSS alone or EBSS containing Spautin-1 for 48hs.
I. Confocal imaging of eGFP-LC3B and LDs in differentiated 3T3-L1 adipocytes virally transfected with eGFP-LC3B and incubated in EBSS alone or EBSS containing bafilomycin A for 48hs. Scale bar,10 μm (5 μm in insets). To Right, Up: percentage of eGFP-LC3B-positive LDs in the cell. Down: Percentage of cells with eGFP-LC3B-positive LDs. Quantifications are from three independent experiments. Student’s unpaired t-test is used (* P<0,05, ns P>0,05).
J. Schematic representation of the impact of swelling of intracellular organelles by incubating the cells with a hypotonic media.
K. Time-lapse imaging experiment performed on Huh7 cells that were transfected with eGFP-LC3B and treated with oleic acid for 24hs, and then incubated in EBSS for 48 hs. At time 0, a hypotonic media was added to induce cell swelling. Imaging was done at the indicated times.
See also Figure S2.
