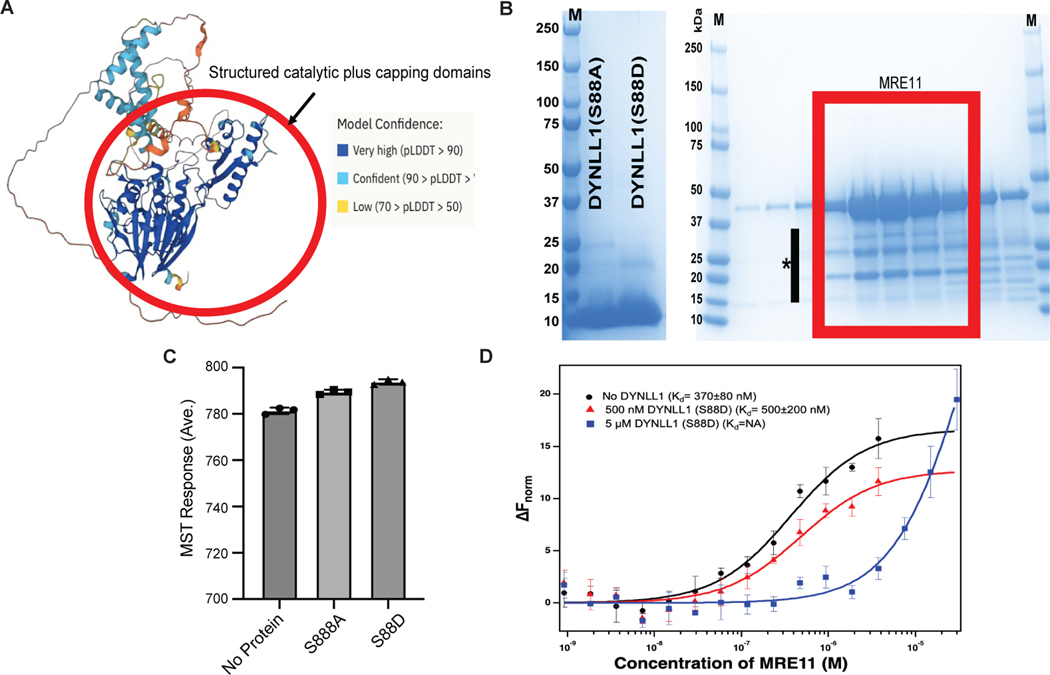
Extended Data Fig. 4: DYNLL1 interferes with MRE11 dimerization. Related to Fig. 4.
(a) Predicted structure of full-length MRE11 created by AlphaFold Monomer V2 for Uniprot Accession number P49959. The structured catalytic domain of MRE11 is highlighted with a red circle. The model is color coded in terms of confidence in prediction and respective color schemes for the confidence is given in the figure. In general, disordered regions have less confidence in model prediction, thus indicating the unstructured regions of MRE11 beyond capping domain. (b) Coomassie-stained protein gels indicating the quality of the recombinant protein used in the current study. Left: DYNLL1 mutants after cleaving the His-tag with TEV protease. Right: MRE11 catalytic domain after the gel-filtration purification step. The red rectangle indicates the fractions that are combined. M indicates the protein standards and * indicates the MRE11 degradation bands. (c) Average MST response (n = 3) measured from labeled MRE11 in the MST buffer or MST buffer with 5 μM DYNLL1-S88A or DYNLL1-S88D mutant. (d) Change in the normalized fluorescence (ΔFnorm) as result of thermophoresis in the MST experiment plotted as a function of concentration of unlabeled MRE11. The resulting curves represents MRE11 dimerization in the absence of any DYNLL1 (black circles), in the presence of 500 nM DYNLL1-S88D (red triangles) or in the presence of 5 μM DYNLL1-S88D (blue squares). The Kd values are measured by fitting the curves with Kd model in the analysis software. (B-D) The data points represent average of three independent measurements and error bars represents standard deviation.

