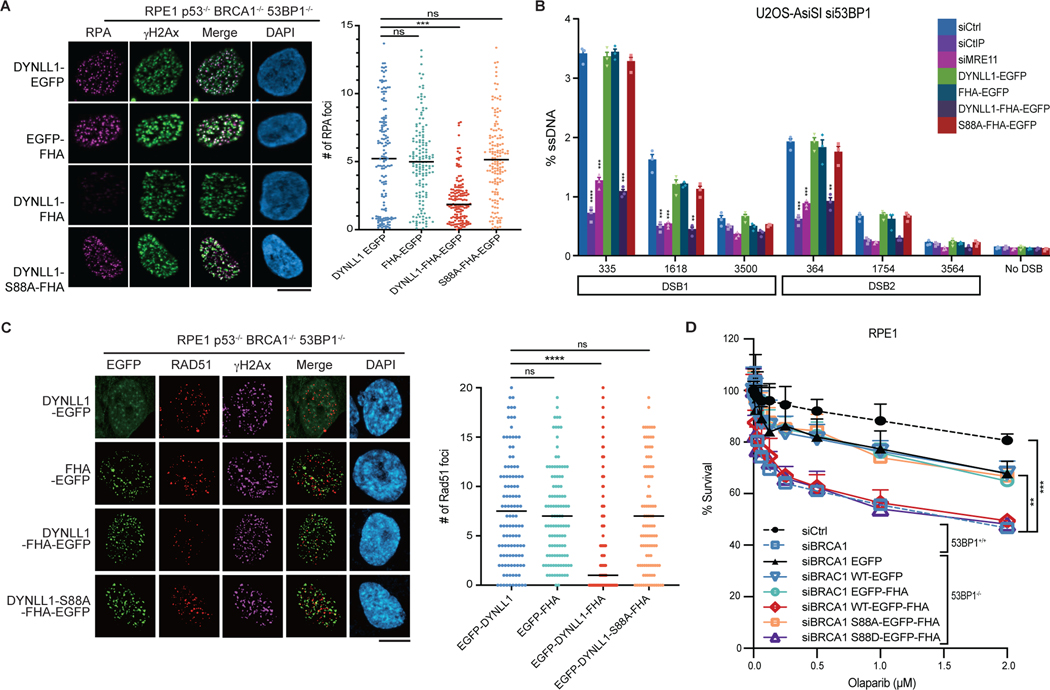
Fig. 3: Functional effect of DYNLL1 at DSBs in 53BP1-deficient cells.
a, Immunofluorescence of RPE1 p53−/− BRCA1−/− 53BP1−/− cells expressing EGFP-tagged DYNLL1 or FHA–DYNNL1 constructs exposed to 2 Gy of irradiation for 4 h, and stained with, antibodies against GFP (DYNLL1), RPA32 and γH2AX. b, U2OS AsiSI cells cotransfected with siRNA against 53BP1 and EGFP-tagged DYNLL1 or FHA–DYNLL1 constructs were treated with 300 nM 4-OHT for 4 h, and ssDNA formation was determined at various sites downstream of the break via PCR quantification. siCtrl denotes non-targeting control siRNA; siCtIP denotes siRNA against CtIP (also known as RBBP8). c, Immunofluorescence of RPE1 p53−/− BRCA1−/− 53BP1−/− cells expressing EGFP-tagged DYNLL1 or FHA–DYNNL1 constructs exposed to 2 Gy of irradiation for 4 h. Cells were stained with antibodies against GFP (DYNLL1), RAD51 and γH2AX. d, RPE1 p53−/− 53BP1−/− cells were cotransfected with siRNA against BRCA1 (siBRCA1) and EGFP-tagged DYNLL1 or FHA–DYNLL1 constructs, and treated with indicated concentrations of olaparib for 6 days. Survival was determined via a cell viability assay. In a–d, n = 3 biologically independent experiments, counting at least 100 cells per experiment. Error bars represent mean ± s.e.m. P values were calculated using two-sided unpaired t-tests (a,c) or nonregression curve analysis (d). **P < 0.01, ***P < 0.001, ****P < 0.0001. Black lines in dot plots represent medians. Scale bars, 20 μm.

