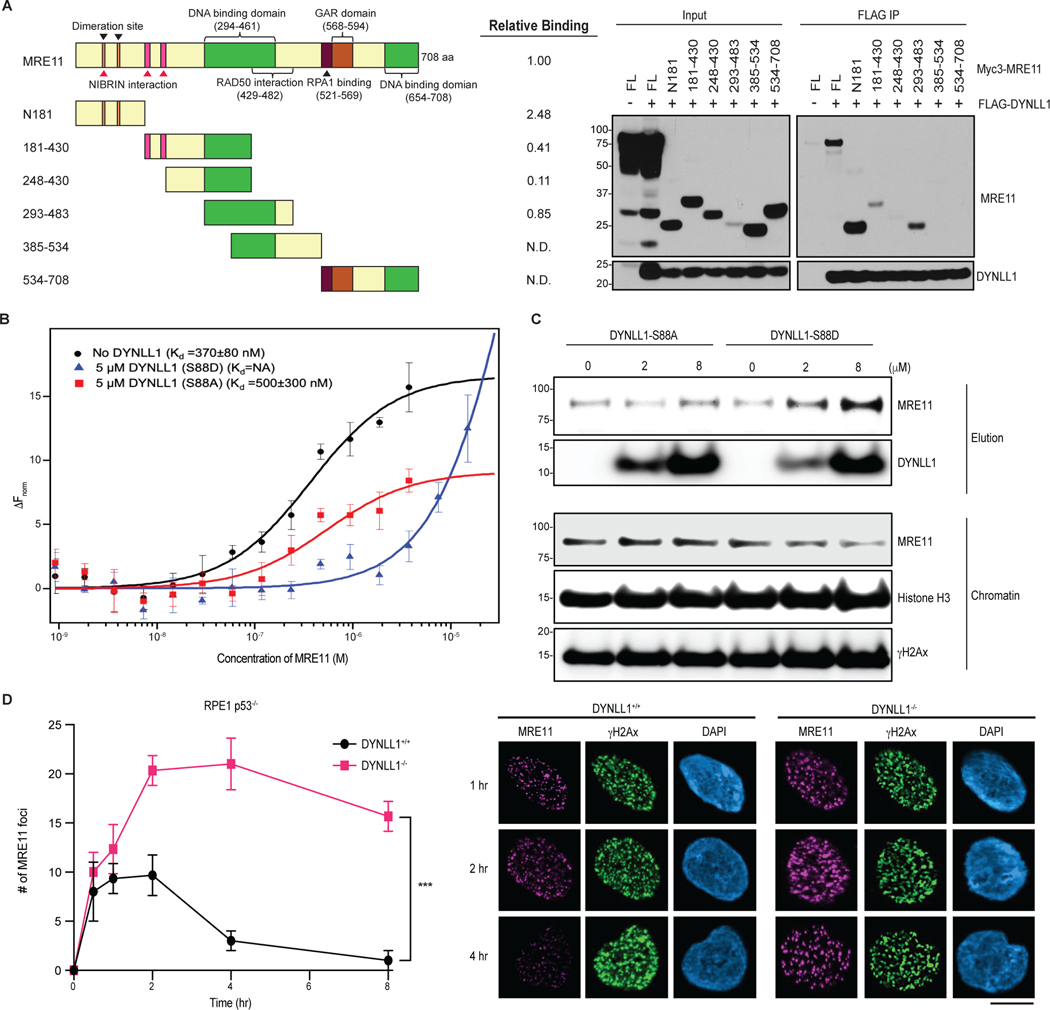
Fig. 4: DYNLL1 disrupts MRE11 dimerization to impair its retention on chromatin.
a, Left: schematic of MRE11 truncation mutants. Right: relative binding of MRE11 mutants and DYNLL1. Immunoprecipitation (IP) from cells coexpressing Flag–DYNLL1 and Myc3–MRE11 truncation mutants. ND, not detected. b, Change in the normalized fluorescence (ΔFnorm) as a result of thermophoresis in the MST experiment plotted as a function of the concentration of unlabeled MRE11. The resulting curves represent MRE11 dimerization in the absence of any DYNLL1 (black circles), or in the presence of 5 μM DYNLL1-S88D (blue triangles) or 5 μM DYNLL1-S88A (red squares). The dissociation constant (Kd) values are measured by fitting the curves with the Kd model in the analysis software. Data are mean and s.d. of three independent measurements. c, Western blot analysis of purified DYNLL1-S88D and DYNLL1-S88A proteins (Extended Data Fig. 4b) incubated with pre-extracted chromatin from HEK293T cells after 5 Gy of irradiation. Incubation of recombinant DYNLL1-S88D but not DYNLL1-S88A protein resulted in increased MRE11 elution from damaged chromatin. d, Immunofluorescence of DYNLL1+/+ and DYNLL1−/− cells exposed to 2 Gy of irradiation and fixed at various time points after irradiation. a–d, n = 3 biologically independent experiments, counting at least 100 cells per experiment. Error bars represent s.d. (b) or mean ± s.e.m. (d). P values determined by two-sided unpaired t-tests. ***P < 0.001. Scale bar, 20 μm.

