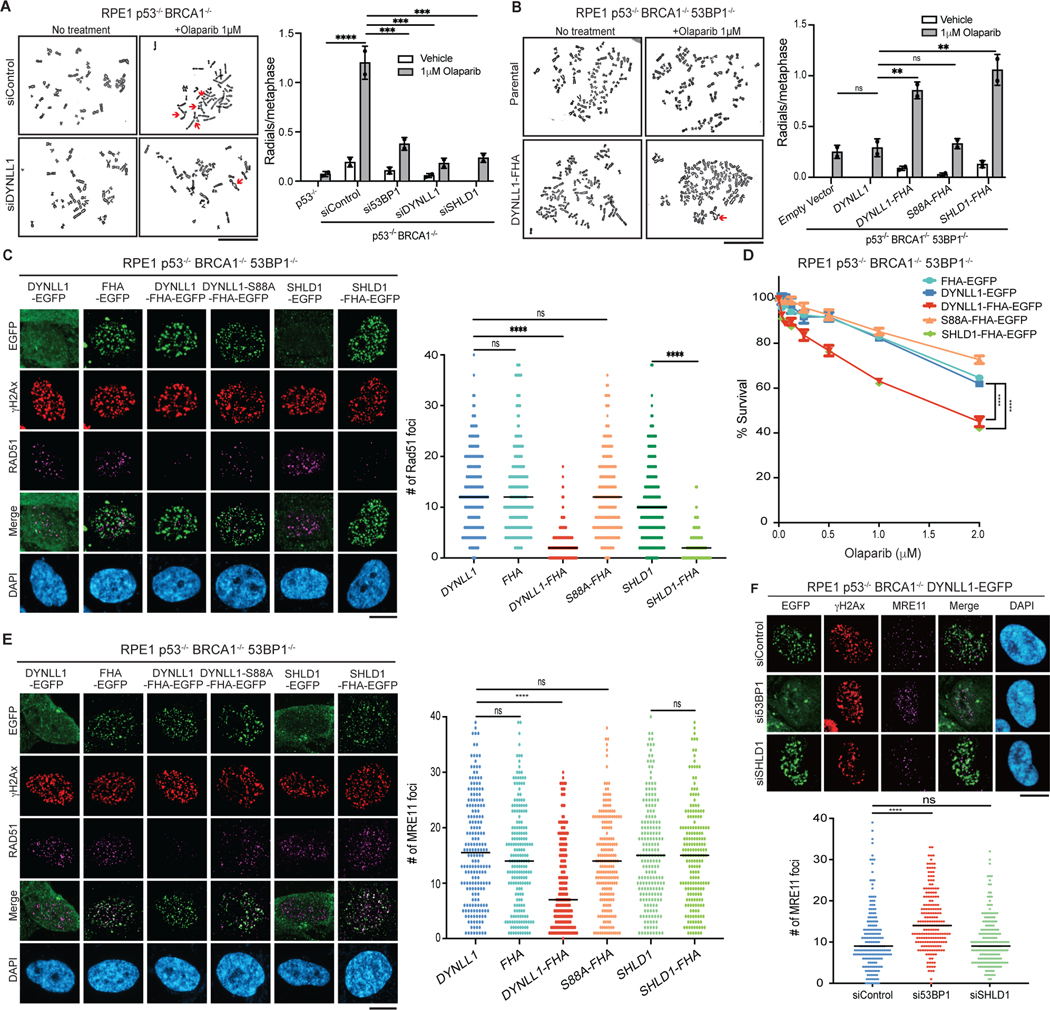
Fig. 5: Functional comparison of DYNLL1 and the Shieldin complex.
a, RPE1 p53−/− BRCA1−/− cells depleted of 53BP1, DYNLL1 or SHLD1 were treated with olaparib. Representative images of metaphase spreads (left) and quantification of the number of redials per cell (right) are shown. b, RPE1 p53−/− BRCA1−/− 53BP1−/− cells expressing DYNLL1–FHA or SHLD1–FHA constructs were treated with olaparib. Representative images of metaphase spreads (left) and quantification of the number of radials per cell (right) are shown. c, Immunofluorescence of cells expressing EGFP-tagged DYNLL1, FHA–DYNLL1 or SHLD1–FHA constructs exposed to 2 Gy of irradiation for 4 h, and stained using antibodies against RAD51, GFP (DYNLL1) and γH2AX. d, RPE1 p53−/− BRCA1−/− 53BP1−/− cells expressing EGFP-tagged DYNLL1, FHA–DYNLL1 or SHLD1–FHA constructs were treated with indicated concentrations of olaparib for 6 days, and cell survival was determined via a cell viability assay. e, Immunofluorescence of cells expressing EGFP-tagged DYNLL1, FHA–DYNLL1, or SHLD1–FHA constructs exposed to 2 Gy of irradiation for 2 h, and stained using antibodies against MRE11, GFP (DYNLL1) and γH2AX. f, Immunofluorescence of RPE1 p53−/− BRCA1−/− 53BP1−/− cells coexpressing EGFP- tagged DYNLL1 and indicated siRNAs exposed to 2 Gy of irradiation for 2 h, and stained using antibodies against GFP, γH2AX and MRE11. n = 2 (a,b) or n = 3 (c–f) biologically independent experiments, counting at least 100 cells per experiment. Error bars represent mean ± s.e.m. P values were determined by two-sided unpaired t-tests (a–c,e,f) or nonregression curve analysis (d). **P < 0.01, ***P < 0.001, ****P < 0.0001. Black lines in dot plots represent medians. Scale bars, 20 μm.

