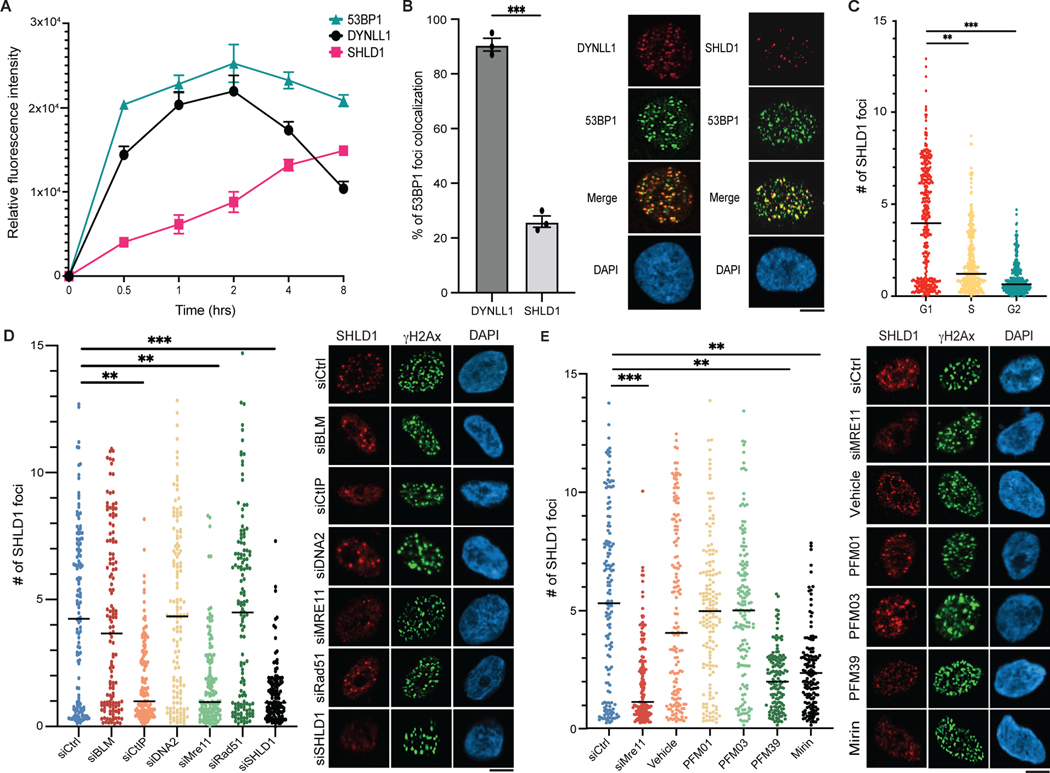
Fig. 6: Kinetics and dependencies of Shieldin complex recruitment to DSBs.
a, RPE1 cells were pretreated with EdU, exposed to 10 Gy of irradiation, and fixed at indicated time points. Cells were processed for immunofluorescence using antibodies against 53BP1, DYNLL1, SHLD1 and γH2AX. Relative fluorescence intensity is normalized to γH2AX. EdU-negative cells were quantified. b, Immuofluorescence of RPE1 cells pretreated with EdU, exposed to 10 Gy of irradiation for 4 h, and stained using antibodies against DYNLL1 and 53BP1, or SHLD1 and 53BP1. Colocalization of DYNLL1 or SHLD1 foci with 53BP1 foci in EdU-negative cells is quantified. c, RPE1 cells were transduced with lentivirus composed of the Fucci system reporter assay. Cells were exposed to 10 Gy of irradiation, fixed 6 h later and processed using antibodies against geminin, CDT1 and SHLD1. d,e, Cells were transfected with the indicated siRNA (d) or treated with MRE11 endo- and exonuclease inhibitors (e). Cells were pretreated with EdU for 30 min, then exposed to 10 Gy of irradiation and fixed 6 h later to be processed for immunofluorescence. EdU-negative cells were quantified. a–e, n = 3 biologically independent experiments, counting at least 100 cells per experiment. Error bars represent mean ± s.e.m. P values were determined using two-sided unpaired t-tests. **P < 0.01, ***P < 0.001, ****P < 0.0001. Black lines in dot plots represent medians. Scale bars, 20 μm.

