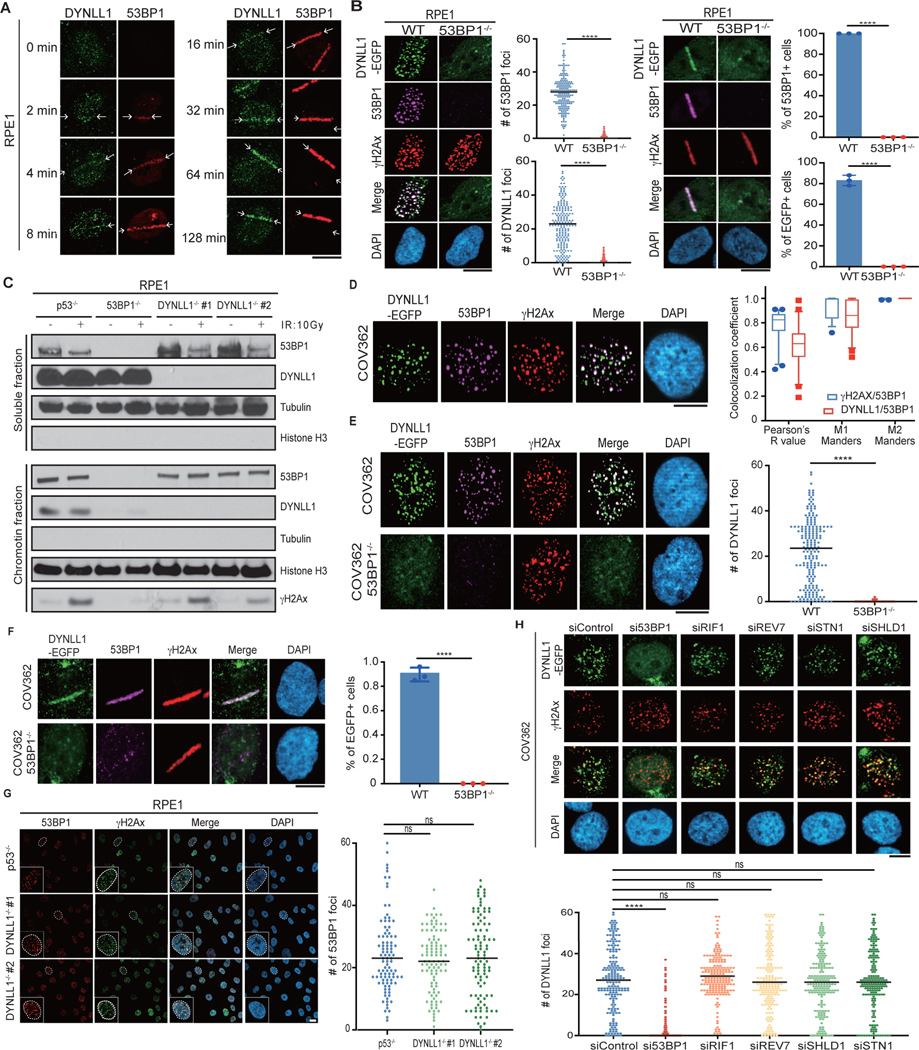
Extended Data Fig. 1: 53BP1 is necessary for chromatin localization of DYNLL1. Related to Fig. 1.
(a) Representative immunofluorescence images of RPE1 cells subjected to laser microirradiation. Cells were fixed at indicated time points post laser microirradiation and processed for immunofluorescence with DYNLL1 and 53BP1 antibodies. (b) Representative images of RPE1 wild-type or 53BP1−/− cells 2 h after exposure to 2 Gy irradiation or laser microirradiation. Cells were fixed and processed for immunofluorescence using antibodies against 53BP1, GFP (DYNLL1), and γH2AX. (c) RPE1 cells depleted of p53, 53BP1, or DYNLL1 using CRISPR/Cas9 were exposed to 10 Gy irradiation. Protein was collected after 3 h. Localization of DYNLL1 to chromatin was evaluated by subcellular fractionation followed by immunoblotting for DYNLL1. (d–f) Representative images of COV362 cells (D) and COV362 wild-type or 53BP1−/− cells (e, f) exposed to 2 Gy irradiation (d, e) or laser microirradiation (F). 2 h post-recovery cells were fixed and processed for immunofluorescence using antibodies against 53BP1, GFP (DYNLL1), and γH2AX. Box plots show mean and center, quartiles (boxes), and range (whiskers)(d). (g) Representative immunofluorescence images of RPE1 cells depleted of DYNLL1 using CRISPR/Cas9 and exposed to 2 Gy irradiation. 1h post-irradiation, cells were fixed and processed for immunofluorescence using antibodies against 53BP1 and γH2AX. (a-g) n = 3 biologically independent experiments, counting ≥ 100 cells per experiment. Error bars represent the mean±s.e.m. P-values for foci quantification and “laser positive” cell analysis were calculated using two-sided unpaired t-tests. P values are indicated by nonsignificant (P >0.05), *(P < 0.05), **(P < 0.01), ***(P < 0.001), ****(P<0.0001). Black line in dot plots represent median. Scale bar = 20μm.

