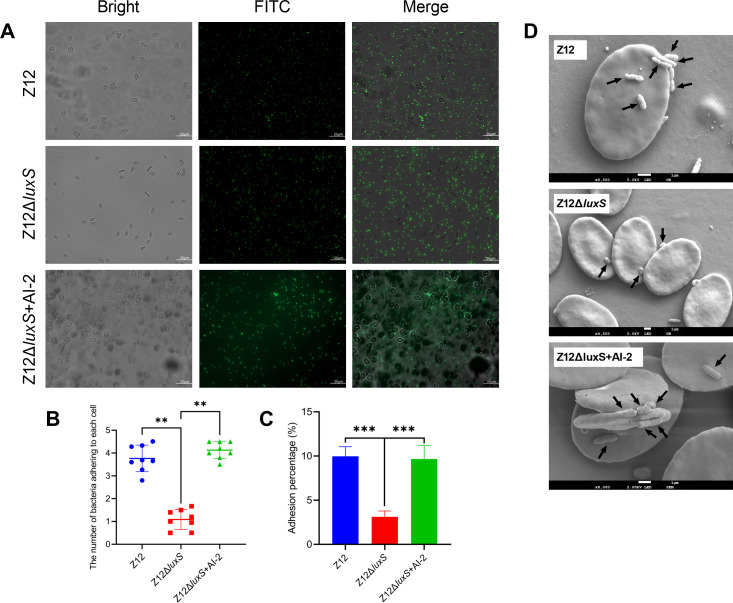
Fig 2.
The effect of AI-2 on adherence of A. veronii to erythrocytes. (A) The adherence of FITC-labeled bacterial cells to erythrocytes. Scale bars represent 20 µm. (B) The number of bacterial cells adhering to each erythrocyte. (C) Adhesion percentage of strains Z12, Z12ΔluxS, and Z12ΔluxS + AI-2. (D) Scanning electron microscopy analysis of adherence by strains Z12, Z12ΔluxS, and Z12ΔluxS + AI-2 to erythrocytes. Arrows represent where bacterial cells adhering to erythrocyte. Data are presented as mean ± SD. ** represents a statistically significant difference of P < 0.01. *** represents a statistically significant difference of P < 0.001.

