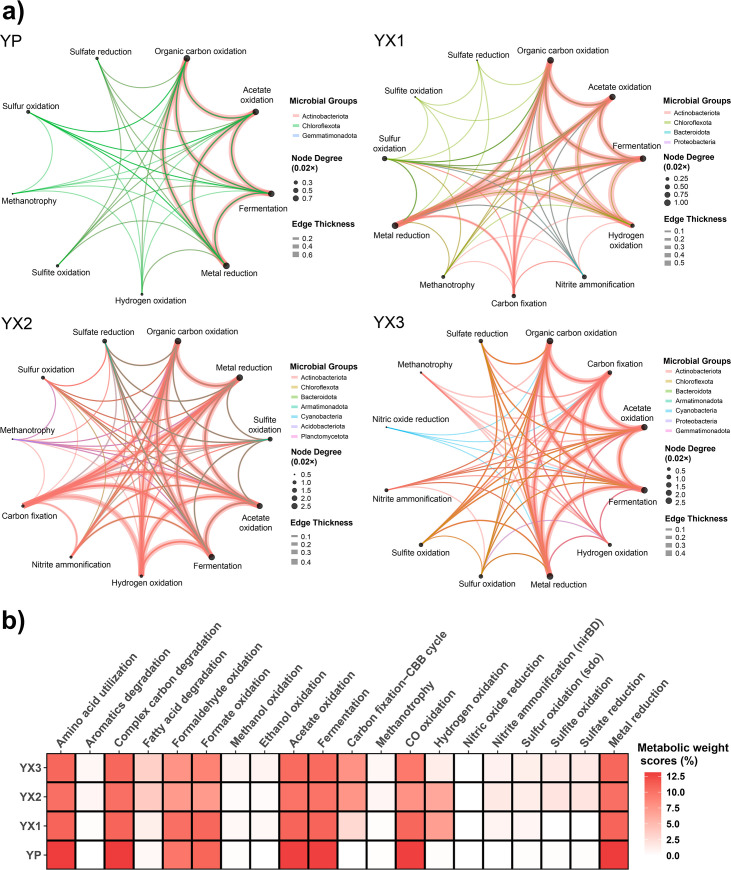
Fig 4.
Metabolic and biogeochemical functional trait profile analysis of metagenomes and genomes. (a) Microbial community functional network of MAGs from the bare soil sample YP and three sheltered soil samples (YX1-3). Nodes represent different biogeochemical processes, and the size of the node was depicted according to the number of connections. Edges connecting two nodes represent functional connections, and edge thickness was determined by the average gene coverage values of the two nodes. Edge colors represent different taxa contributing to biogeochemical processes. (b) Weights of different metabolic functions in four metagenomes. The metabolic weight score (MW-score) was calculated by METABOLIC v4.0 based on gene coverage, which reflects function weights in metagenomes.

