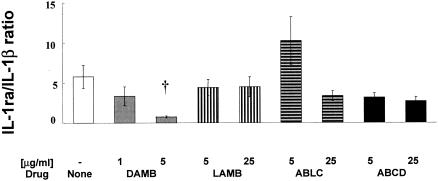
FIG. 3.
IL-1ra/IL-1β ratio of total cytokines produced by human MNCs incubated with no drug (MNC) or with amphotericin B formulations DAMB (1 and 5 μg/ml) or LAMB, ABLC, and ABCD (5 and 25 μg/ml) for 6 h. The values are means ± SE of values derived from five experiments. Comparisons between drug-treated and untreated control cells (MNCs) were performed by ANOVA with Dunn's test for multiple comparisons. Statistically significant difference from untreated MNCs (controls) with P < 0.01 is indicated by a dagger (†).

