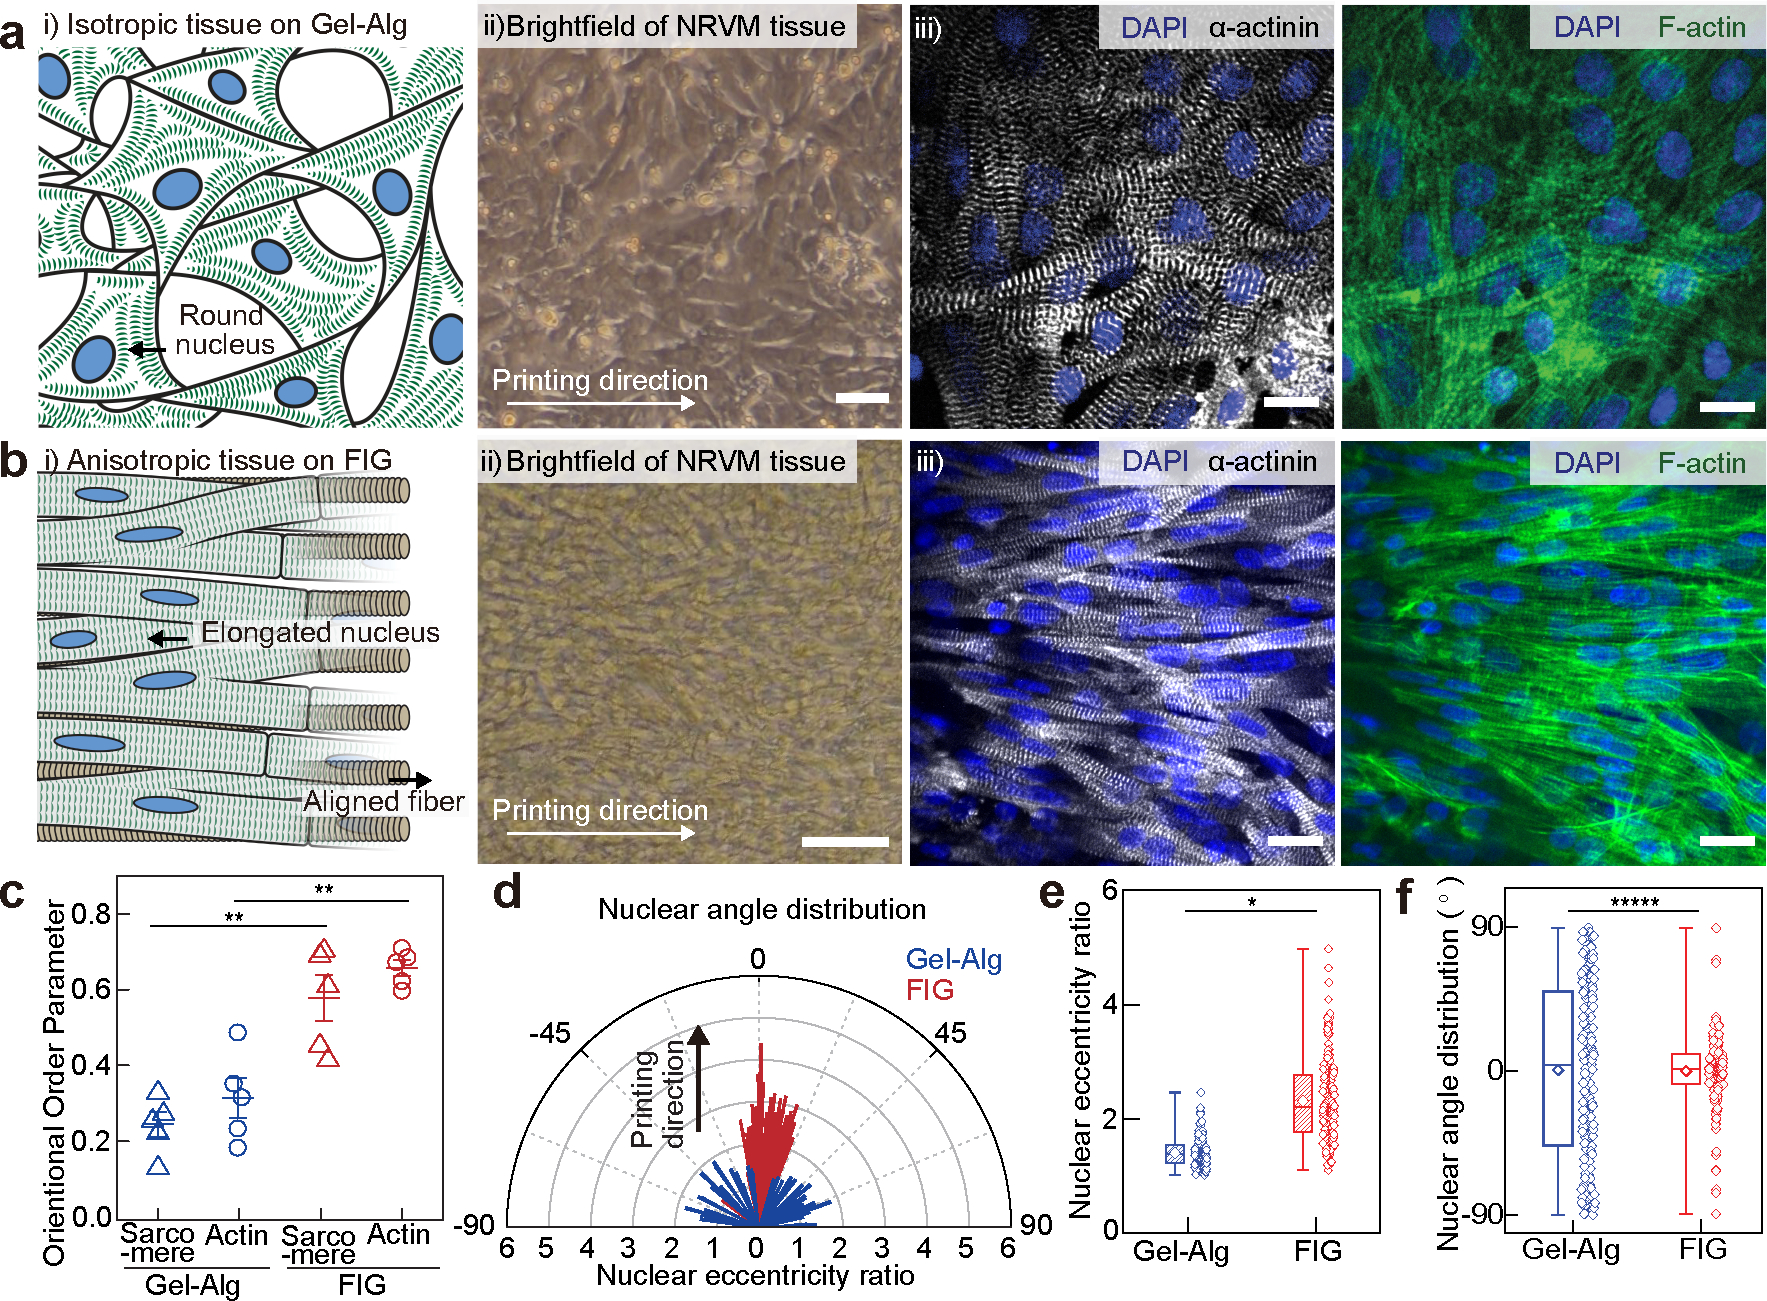
Fig. 2. Anisotropic intra- and inter-cellular organization of cardiac tissues cultured on printed FIG scaffolds.

a-b, i) Schematic illustrations showing neonatal rat ventricular myocyte (NRVM) tissue formation on the 2D printed Gel-Alg hydrogel (a) and FIG (b) scaffolds, ii) brightfield images of NRVM cultured on each scaffold, and iii) representative immunostained images of nuclei (blue), α-actinin (grey), and F-actin (green). Scale bars, 20 μm. c, Normalized sarcomeric α-actinin and F-actin alignment with their alignment quantified on a scale of 0 (random) to 1 (aligned) using an orientation order parameter. Statistical analysis was performed using a two-tailed student’s t-test with unequal variance, **P=0.000252 and 0.00149 for sarcomere and F-actin, respectively. n=5 tissues per scaffold condition. Data are presented as mean values +/− SEM. d, Representative distribution of nuclear shape (line length: eccentricity ratio) and orientation (line angle) with printing direction at 0°. e-f, Nuclear eccentricity ratio (e) and angle (f) from −90° to 90° (n = 203 and 183 nuclei from 3 tissues on Gel-Alg and FIG scaffolds, respectively). Statistical analysis was performed using a two-tailed student’s t-test with unequal variance, *P=0.0295 (e) and a two-sample Kolmogorov-Smirnov test, *****P=3.46e-10. (f). n =203 and 183 nuclei from 3 independent tissues on Gel-Alg and FIG scaffolds, respectively. Box plot: center diamond, box limits, and whiskers indicates mean, the first and third quartiles, and max-min, respectively.
