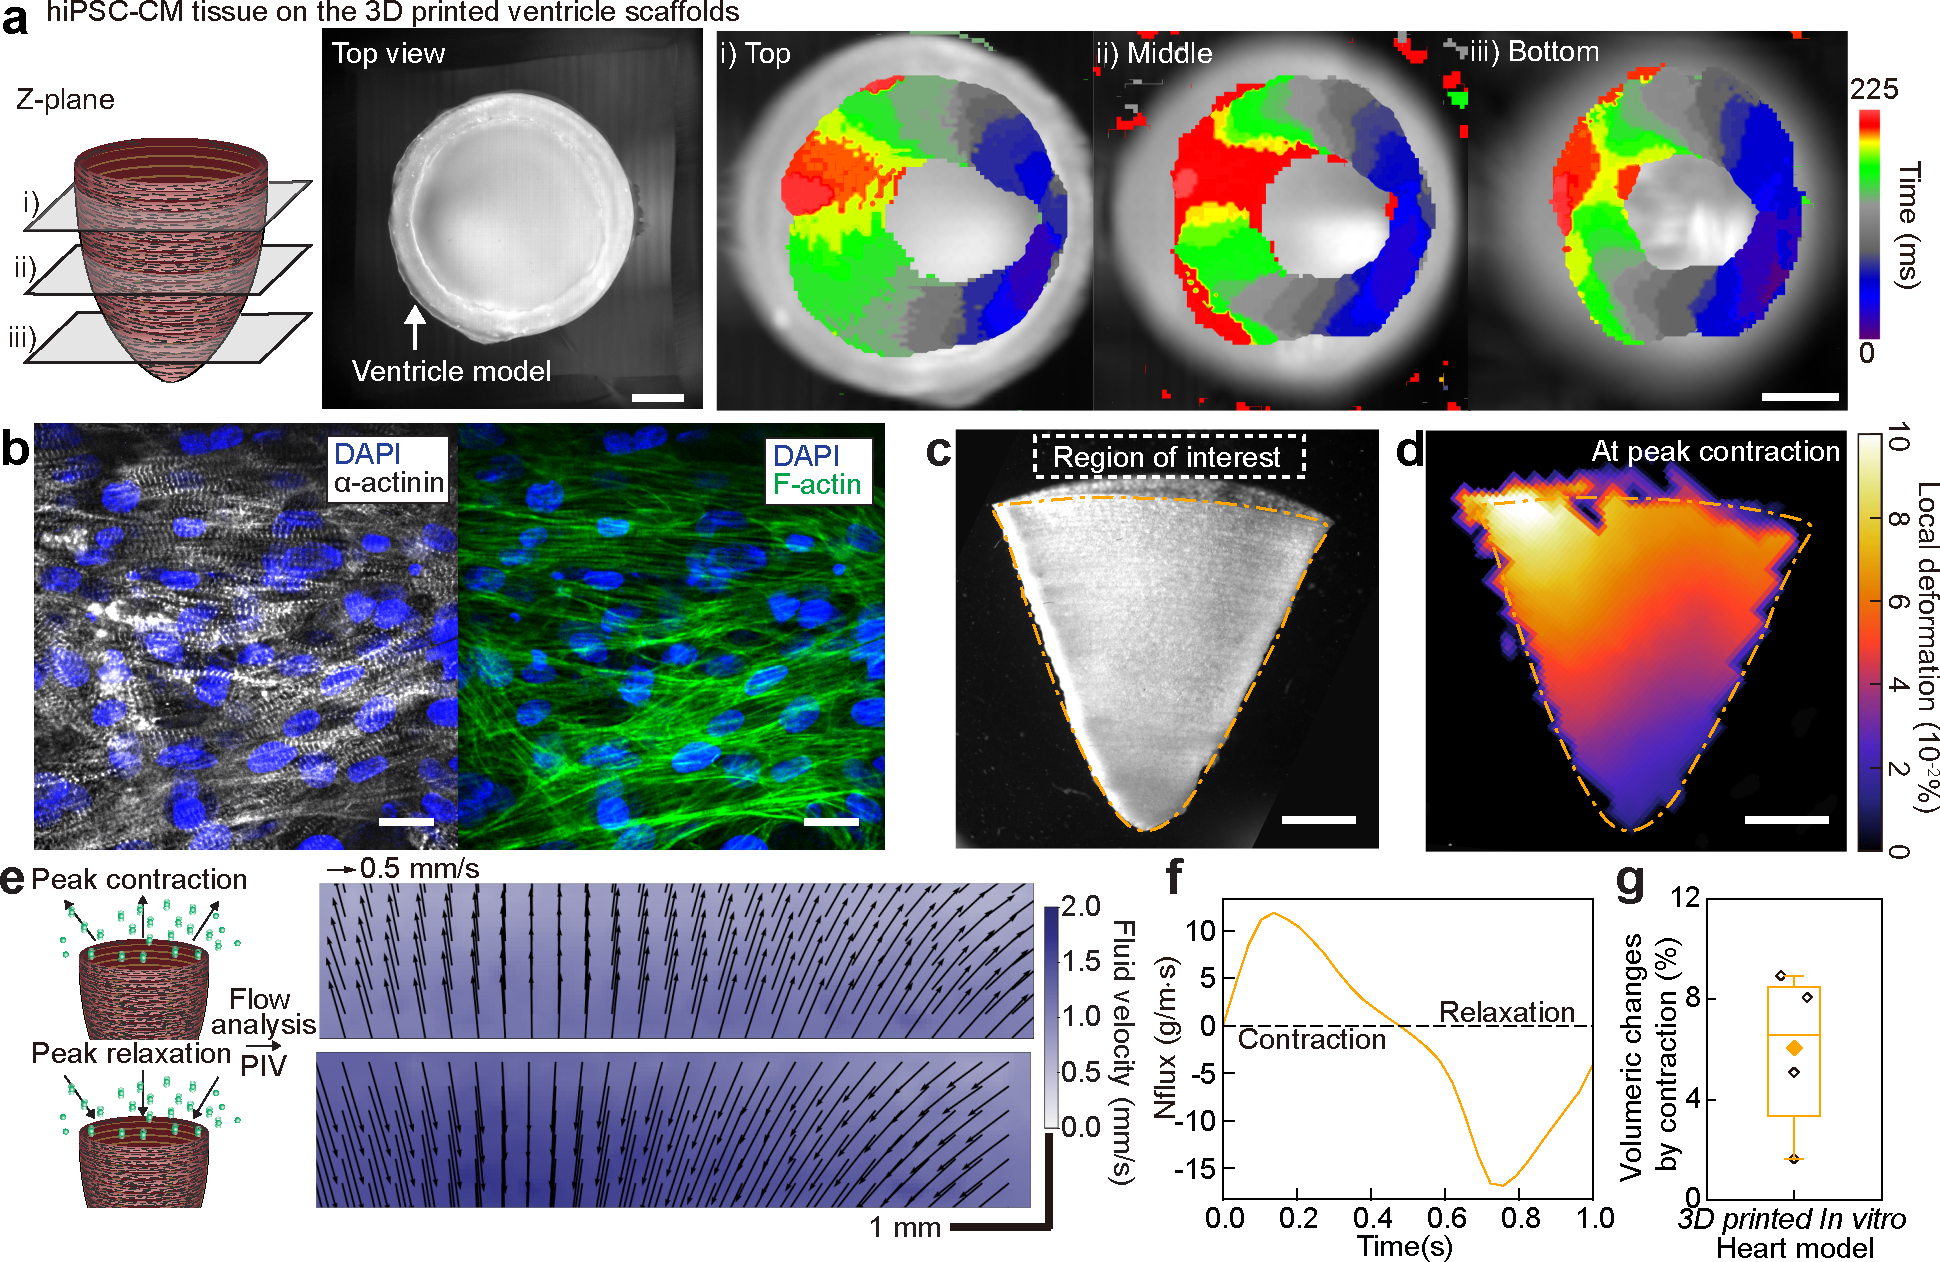
Fig. 4. Structural, electrophysiological, and contractile properties of human stem cell-based tissue-engineered 3D ventricle models.

a, Spontaneous Ca2+ transient propagation on a human induced pluripotent stem cell-derived cardiomyocyte (hiPSC-CM) 3D printed ventricle model (top view), showing anisotropic Ca2+ propagation along the printing direction. Scale bar, 2 mm. b, Immunostained images of hiPSC-CM tissues cultured in 3D printed model ventricle scaffolds. Scale bar, 20 μm. c, A brightfield image of the tissue-engineered 3D ventricle model after hiPSC-CMs were cultured for 14 days. Scale bar, 2 mm. d, Representative deformation map of the 3D hiPSC-CM ventricle model at peak contraction. Scale bar, 2 mm. e, Fluid velocity maps at peak contraction (top) and peak relaxation (bottom) analyzed by tracking fluorescent bead displacement in a region of interest under 1 Hz electrical field stimulation. Scale bar, 1 mm. f, Instantaneous mass flux in a region of interest for a representative ventricle during a complete cycle of contraction and relaxation. g, Volumeric changes by contraction of hiPSC-CM 3D ventricle models. n = 4 ventricle models. Box plot: center diamond, box limits, and whiskers indicates mean, the first and third quartiles, and max-min, respectively.
