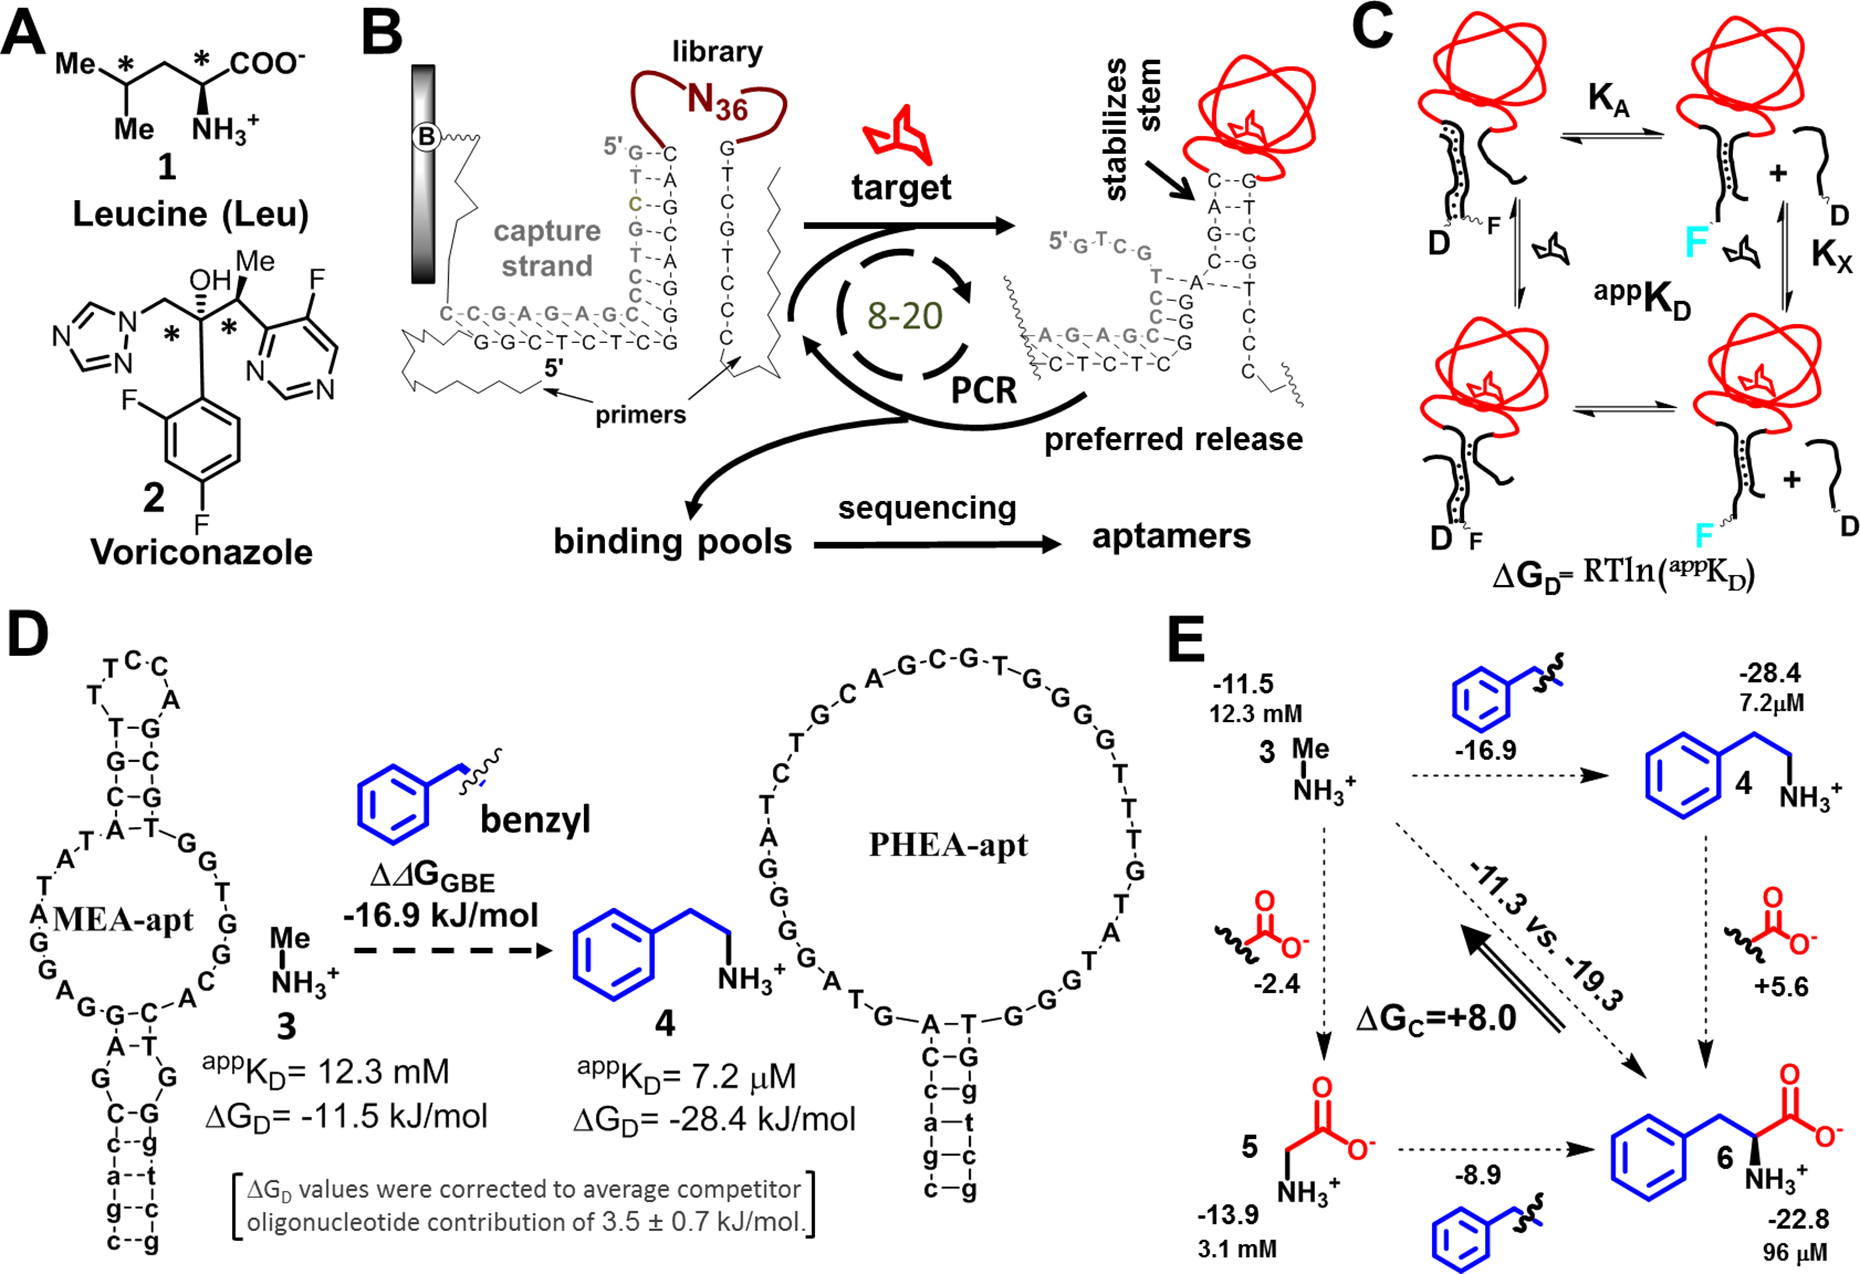
Figure 1. Target functional-group binding free energy analysis for aptamers from stem-loop libraries:

(A) Using standard protocol, we were unable to isolate aptamers for leucine (1) and voriconazole (2), which have congested pairs of carbons (*). (B) Aptamer selections driven by small-molecule-induced stem closures: An oligonucleotide library with a random loop (N36) is hybridized to the complement (capture strand) of a PCR primer. The capture strand is tethered to a column. The column is exposed to target solutions. Sequences that bind the targets and undergo stem stabilization are released, preferentially amplified, and used in the next selection cycle. (C) We measured apparent appKD values for aptamers and from these calculated the free energies of displacement, ΔGD, based on a fluorescence displacement assay associated with the equilibrium between an aptamer (labeled with fluorescein, F) and a complementary oligonucleotide used for capture in selection (labeled with a quencher, dabcyl, D). Target leads to concentration-dependent increases in fluorescence via equilibria shown. KX and KA and are dissociation constants for a target-aptamer complex without competitor and an aptamer-competitor complex without target, respectively. (D) We isolated the contributions of individual functional groups by subtracting individual ΔGD values of aptamer-target pairs, with these values corrected to account for differences in oligonucleotide quenching. Here, the two targets, methylamine (3) and phenylethylamine (4), differ by a benzyl group. The difference in free energy associated with benzyl group addition is ΔΔGGBE (benzyl). Two aptamers used for this calculation are shown. (E) Cooperativity is assessed by double functional group replacement cycles (18). The appKD and ΔGD (normalized to average impact of oligonucleotide on equilibrium, in kJ/mol) values are shown next to the targets, with ΔΔGGBE values shown next to the fragments. A ΔΔGGBE>0 indicates a decrease in affinity upon adding a functional group; the ΔGC value (+8.0 kJ/mol) represents the difference between adding functional groups separately (upper horizontal and left vertical values) vs. at the same time (diagonally), which is interpreted as negative cooperativity when both benzyl group and a carboxylate are together present in a molecule.
