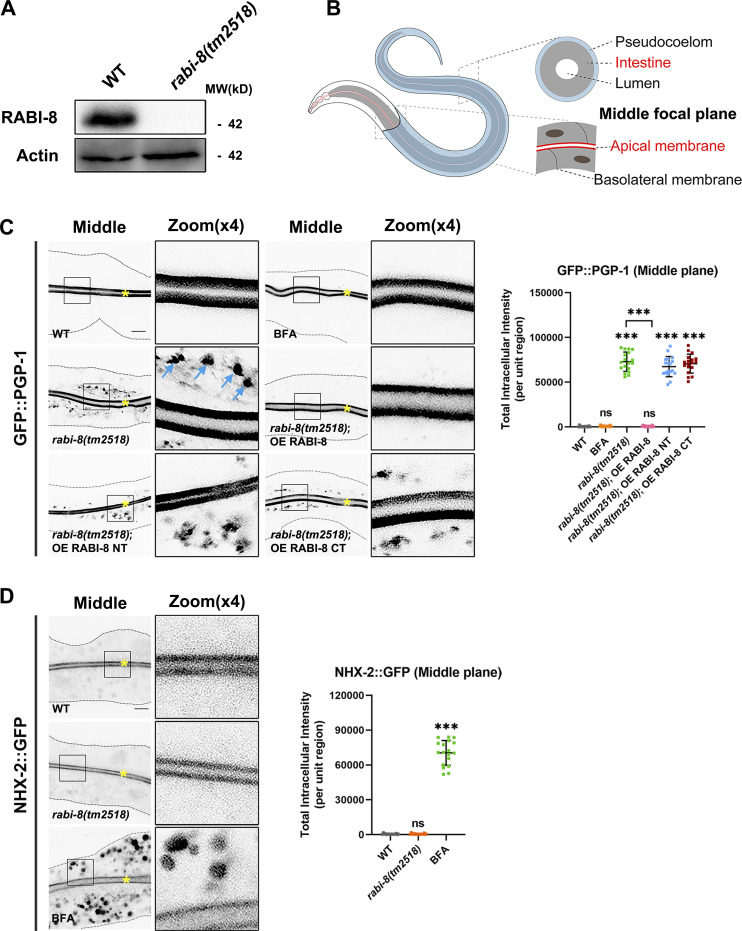
Figure 1.
Loss of RABI-8 impairs the delivery of apical Golgi-bypassing membrane cargoes. (A) A representative immunoblot of RABI-8 in lysates from wild-type and rabi-8(tm2518) mutant animals. Compared with wild-type, levels of RABI-8 are dramatically decreased in rabi-8(tm2518) mutants. (B) A schematic diagram of C. elegans intestine, showing the apical and basolateral membranes. The imaging plane where the apical membrane and intestinal lumen can be observed is defined as the middle focal plane of the confocal microscopy. (C) Confocal images of intestinal cells expressing GFP-tagged PGP-1. GFP::PGP-1 is predominantly localized at the apical membrane of intestinal epithelia in L4 larvae and young adults of wild-type animals. BFA treatment did not alter the localization. In contrast, GFP::PGP-1 displayed intracellular accumulation indicated by blue arrows in rabi-8(tm2518) mutants. Overexpression of full-length RABI-8 but not the NT or CT rescued the localization defects of PGP-1 in rabi-8(tm2518) mutants. (D) Confocal images of intestinal cells expressing GFP-tagged NHX-2. In contrast to the predominantly apical-localized NHX-2::GFP in L4 larvae or young adults of wild-type animals, NHX-2::GFP aberrantly accumulated in the cytoplasm of wild-type animals upon BFA treatment. NHX-2::GFP remained unchanged in rabi-8(tm2518) mutants. For quantification, the signals from the apical membrane were avoided by manual ROI selection. Data are shown as mean ± SD (n = 18 each, six animals of each genotype sampled in three different unit regions of each intestine defined by a 100 × 100 [pixel2] box positioned at random). Statistical significance was determined using a one-way ANOVA followed by a post-hoc test (Dunn’s Multiple Comparison Test) for multiple comparisons. ***P < 0.001; ns, no significance. Data distribution was assumed to be normal but this was not formally tested. About one cell length of the intestine is shown in each panel. Scale bars: 10 μm. Yellow asterisks indicate intestinal lumen. Dashed lines indicate the outline of the intestine. Source data are available for this figure: SourceData F1.

