Figure S1.
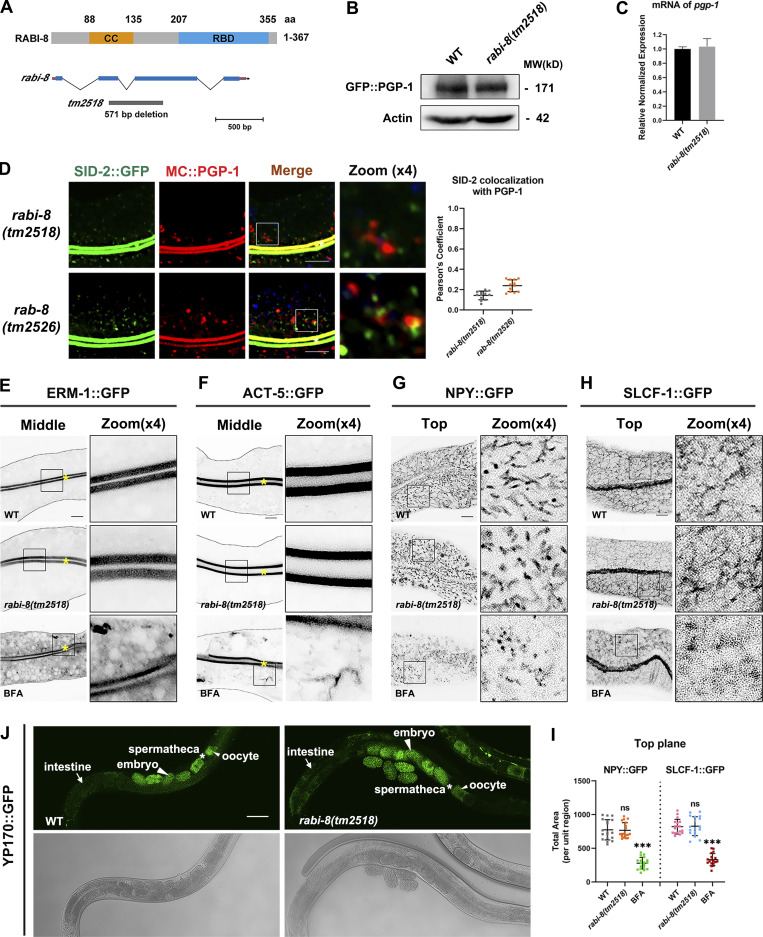
Loss of RABI-8 does not affect the exocytosis of other membrane and soluble cargoes. (A) The schematic domain structure of RABI-8 and rabi-8 locus. The coiled-coil (CC) domain is depicted in orange. The RBD is depicted in blue. The rabi-8 gene structure is shown with filled boxes representing exons and thin lines indicating introns. The arrow delineates the direction of transcription. The gray bars below the transcript show the size and position of the deleted regions in tm2518. (B) A presentative western blot showing expressional levels of GFP::PGP-1 in wild-type and rabi-8(tm2518) mutant animals. (C) RT-PCR showing mRNA expressional levels of PGP-1 in wild-type animals and rabi-8(tm2518) mutants. Each is the average of three replicates. (D) Confocal images and quantification showing the localization pattern of MC::PGP-1 and SID-2::GFP in rabi-8(tm2518) and rab-8(tm2526) mutants. Pearson’s correlation coefficients for GFP and MC signals were calculated (n = 12 animals). The signals from the apical membrane were avoided by manual ROI selection. White asterisks indicate intestinal lumen. Scale bars: 10 μm. (E and F) Compared to wild-type animals, the localization of ERM-1::GFP (E), and ACT-5::GFP (F) remained unchanged in rabi-8(tm2518). ERM-1::GFP (E) and ACT-5::GFP (F) both aberrantly accumulated in the cytoplasm of wild-type animals upon BFA treatment. Scale bars: 10 μm. Yellow asterisks indicate intestinal lumen. Dashed lines indicate the outline of the intestine. (G–I) The basolateral membrane protein NPY::GFP (G) and SLCF-1::GFP (H) exhibited similar tubular localization in wild-type and rabi-8(tm2518) animals. BFA treatment disrupted the normal localization. (I) Quantification of the total area of NPY::GFP in G and SLCF-1::GFP in H. Data are shown as mean ± SD (n = 18 each, six animals of each genotype sampled in three different unit regions of each intestine defined by a 100 × 100 [pixel2] box positioned at random). Statistical significance was determined using a one-way ANOVA followed by a post-hoc test (Dunn’s Multiple Comparison Test) for multiple comparisons. ***P < 0.001; ns, no significance. Data distribution was assumed to be normal but this was not formally tested. About one cell length of the intestine is shown in each panel. Scale bars: 10 μm. (J) Compared to wild-type animals, the distribution pattern of YP170::GFP remained unchanged in rabi-8(tm2518). Spermathecas are indicated by stars. Embryos and oocytes are indicated by big and small arrowheads, respectively. Intestines are indicated by arrows. Scale bars: 100 μm. Source data are available for this figure: SourceData FS1.

