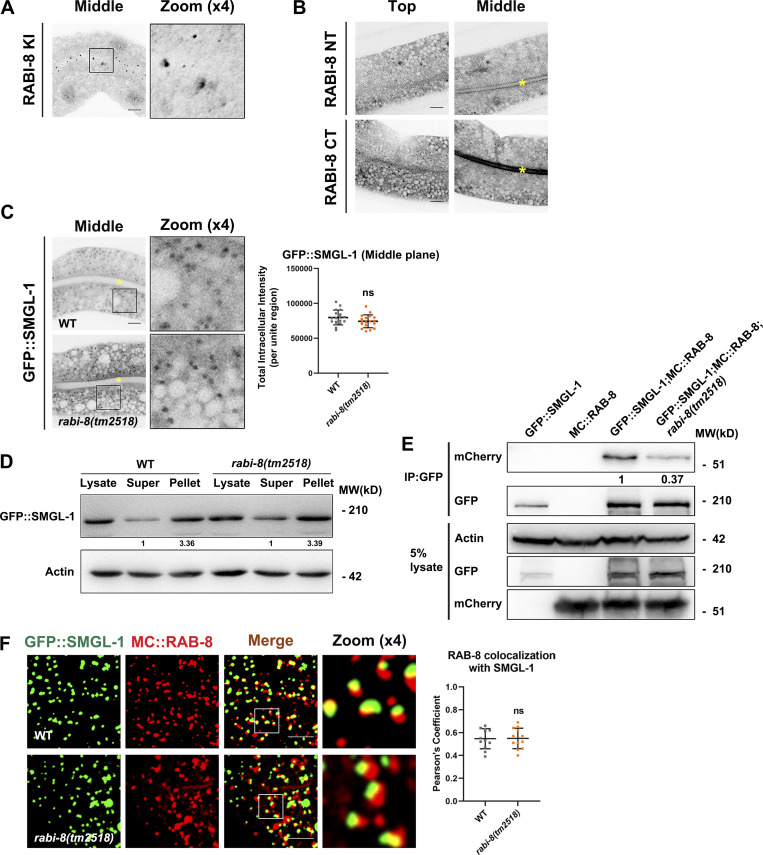
Figure S3.
RABI-8 does not affect the normal localization of SMGL-1 or the association of SMGL-1 with RAB-8. (A) Knock-in (KI) FLAG-RABI-8 via the CRISPR/Cas9 system to add an epitope tag (2xFLAG) to the CT of endogenous RABI-8. (B) Confocal images of intestinal cells expressing GFP-tagged NT and CT of RABI-8. (C) Confocal images of intestinal cells expressing GFP-tagged SMGL-1. Mutation in rabi-8 did not change the localization of GFP::SMGL-1. Data are shown as mean ± SD (n = 18 each, six animals of each genotype sampled in three different unit regions of each intestine defined by a 100 × 100 [pixel2] box positioned at random). Statistical significance was determined using a two-tailed, unpaired Student’s t test. ns, no significance. Data distribution was assumed to be normal but this was not formally tested. Yellow asterisks indicate intestinal lumen. (D) The membrane-to-cytosol ratio of GFP::SMGL-1 did not change notably in rabi-8(tm2518) mutants. Actin served as the loading control. Levels of SMGL-1 were normalized to the corresponding controls and set to one in the supernatant fraction. (E) GFP::SMGL-1 precipitated less MC::RAB-8 in rabi-8(tm2518) mutants in a representative Co-IP assay. (F) Confocal images and quantification showing partial colocalization between GFP::SMGL-1 and MC::RAB-8 in wild-type and rabi-8(tm2518) mutant animals. Pearson’s correlation coefficients for GFP and mCherry signals were calculated (n = 12 animals). Data are shown as mean ± SD (n = 12, 12 animals of each genotype of each intestine defined by a 100 × 100 [pixel2] box positioned at random). Statistical significance was determined using a two-tailed, unpaired Student’s t test. ns, no significance. Scale bars: 10 μm. Source data are available for this figure: SourceData FS3.

