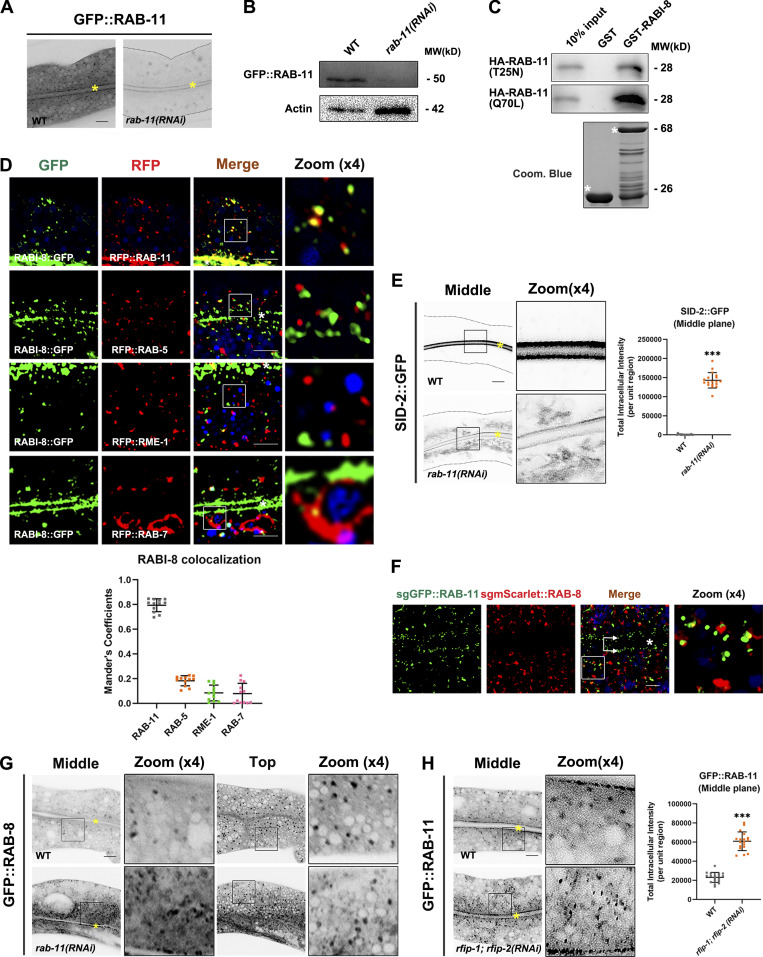
Figure S5.
The subcellular localization of RABI-8, RAB-8, and RAB-11. (A) Confocal images of intestinal cells expressing GFP-tagged RAB-11. RNAi-mediated knockdown of RAB-11 dramatically reduced the fluorescence intensity of GFP::RAB-11. Image brightness and contrast were adjusted identically for both images to reveal the contour of the intestinal cells in rab-11(RNAi) animals. Yellow asterisks indicate intestinal lumen. (B) A representative western blot showing expressional levels of GFP::RAB-11 in wild-type and rab-11(RNAi) animals. (C) GST-RABI-8 pulled down more HA-RAB-11(Q70L) than HA-RAB-11(T25N) in a representative pull-down assay. (D) Confocal images and quantification showing colocalization between RABI-8::GFP and organelle markers in the intestinal cells. RABI-8::GFP puncta overlapped with the subpopulation of RFP:RAB-11. RABI-8::GFP puncta were separated from RAB-5–labeled early endosomes, RME-1–labeled basolateral recycling endosomes and RAB-7–labeled late endosomes. In each set of images, broad-spectrum intestinal autofluorescent lysosome-like organelles can be seen in blue. Manders’ correlation coefficients for GFP and RFP signals were calculated (n = 12 animals). The signals from the apical membrane were avoided by manual ROI selection. Scale bars: 10 μm. White asterisks indicate intestinal lumen. (E) Confocal images of intestinal cells expressing GFP-tagged SID-2. Compared with wild-type animals, SID-2::GFP accumulated in intracellular structures in rab-11(RNAi) knockdown animals. For quantification, the signals from the apical membrane were avoided by manual ROI selection. Data are shown as mean ± SD (n = 18 each, six animals of each genotype sampled in three different unit regions of each intestine defined by a 100 × 100 [pixel2] box positioned at random). Statistical significance was determined using a two-tailed, unpaired Student’s t test. ***P < 0.001. Data distribution was assumed to be normal but this was not formally tested. Scale bars: 10 μm. Yellow asterisks indicate intestinal lumen. Dashed lines indicate the outline of the intestine. (F) Single-copy GFP::RAB-11; mScarlet::RAB-8 animals were imaged by structured illumination microscopy. Double arrows indicate the apical enriched RAB-11 sub-population. Scale bars: 5 μm. White asterisk indicates intestinal lumen. (G) Confocal images of intestinal cells expressing GFP-tagged RAB-8 in wild-type and rab-11(RNAi) animals. (H) Compared with wild-type animals, the GFP::RAB-11 was diffusive and formed smaller puncta in rfip-1; rfip-2 (RNAi) knockdown animals. Data are shown as mean ± SD (n = 18 each, six animals of each genotype sampled in three different unit regions of each intestine defined by a 100 × 100 [pixel2] box positioned at random). Statistical significance was determined using a two-tailed, unpaired Student’s t test. ***P < 0.001. Data distribution was assumed to be normal but this was not formally tested. Scale bars: 10 μm. Yellow asterisks indicate intestinal lumen. Source data are available for this figure: SourceData FS5.

