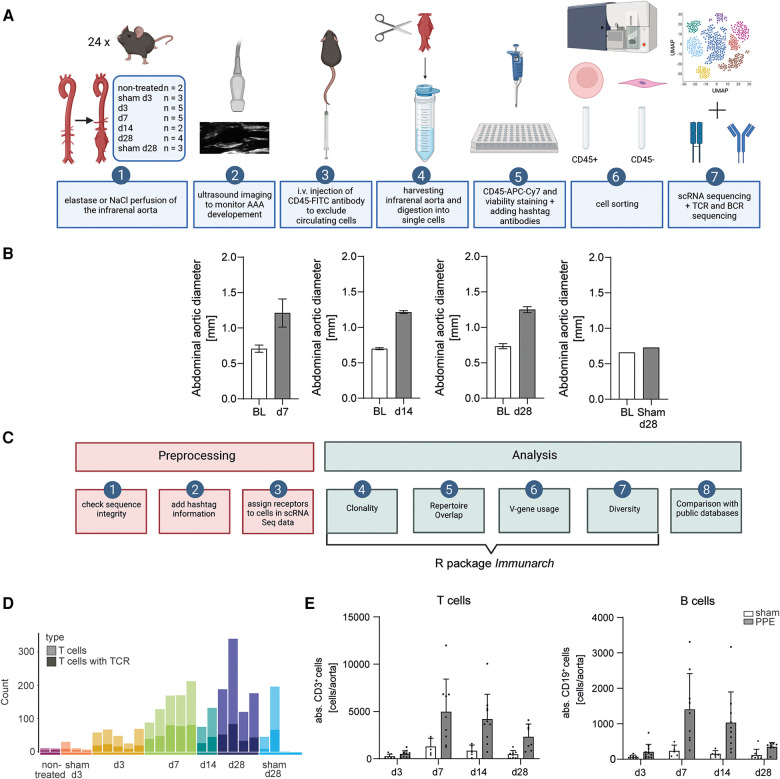
Figure 1.
Experimental and bioinformatic workflow and quality control of the data. (A) Experimental workflow. An AAA was induced in mice via perfusion of the infrarenal aorta with elastase. NaCl perfusion of the aorta served as a sham-operated control. AAA development was monitored by ultrasound imaging. Prior to organ harvesting, the mice were intravenously injected with a fluorophore-labeled CD45 antibody. The harvested infrarenal aortae were digested into single cells and stained with antibodies and hashtags. The cells were sorted for living leukocytes and living non-leukocytes. scRNA sequencing and TCR and BCR scRNA sequencing were performed. (B) The abdominal aortic diameter was analyzed using ultrasound images of baseline (BL) and days 7 (n = 5), 14 (n = 2), and 28 (n = 2) post-PPE surgery and BL and day 28 (n = 1) post-sham surgery. (C) Bioinformatic workflow including preprocessing and data analysis. Three preprocessing steps were performed as quality control for the data. Only fully intact sequences were retained for analysis. The information for the hashtag antibodies was added to the TCR and BCR scRNA sequencing data. The receptors were assigned to the corresponding cells in the scRNA sequencing dataset. The main data analysis including clonality, repertoire overlap, V-gene usage, and diversity was performed with the immunarch R package. In addition, the data were compared with the public databases. (D) T cell amounts (light bar color) and T cell amounts exhibit an intact TCR (dark bar color) in aortic tissue on different AAA disease stages received from scRNA sequencing data. The amount of T cells increases with AAA progression. (E) Flow cytometric analysis of T and B cell amounts of aortic tissue 3 (n = 7), 7 (n = 5), 14 (n = 5), and 28 (n = 8) days after sham operation and 3 (n = 11), 7 (n = 9), 14 (n = 10), and 28 (n = 8) days after PPE-induced AAA formation.

