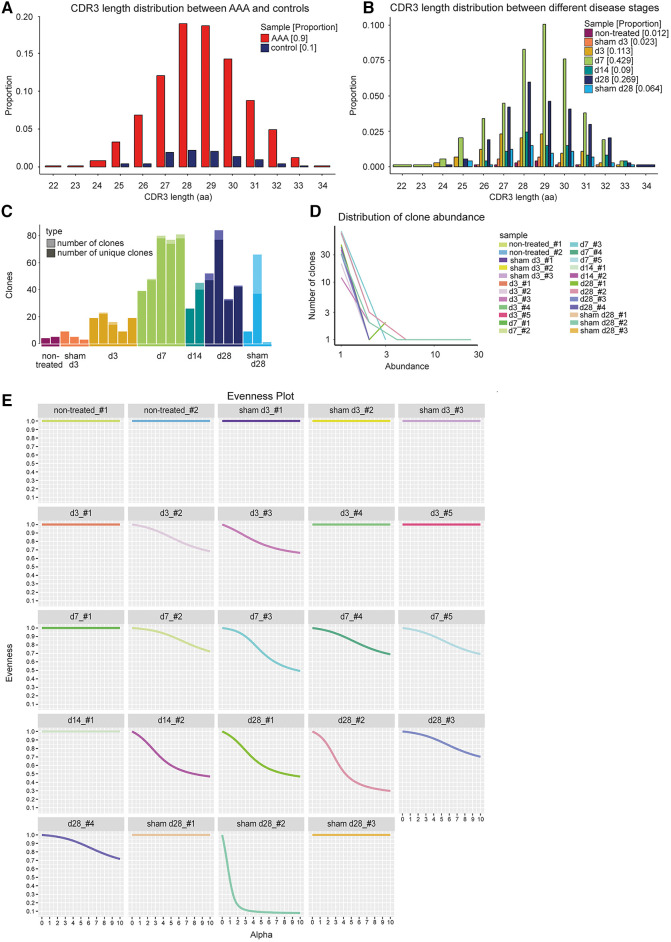
Figure 2.
CDR3 length distribution and clone abundance indicate expanded T cell clones in elastase-induced aneurysm in mice. (A) No changes in CDR3 length distribution of TCRs (paired chains) between AAA including all different disease stages (red) and control samples including sham-operated and non-treated mice (blue). The proportion is plotted against the amino acid (aa) CDR3 length. (B) No alterations in CDR3 length distribution of TCRs (paired chains) between samples of different disease stages (days 3, 7, 14, 28) and sham-operated and non-treated samples (different colors). The proportion is plotted against the amino acid (aa) CDR3 length. (C) Amount of all TCR clones per sample (light bar color) including the amount of unique clones (dark bar color). The majority of TCR clones were found to be unique. Multiple copies of one clone appear only in one of the sham_d28 samples and in 11 of the AAA samples. (D) Line plot indicating the number and abundance of clones per sample. In the sham_d28 sample exhibiting clones with multiple copies, one clone is present 25 times. In contrast, in AAA samples, one clone only appears 2–5 times (E) Evenness plots indicating the extent of clonal expansion for every sample. One sham-operated sample 28 days after perfusion exhibits the highest clonality. The other control samples show no receptor clonality. Eleven AAA samples show some clonal expansion.

