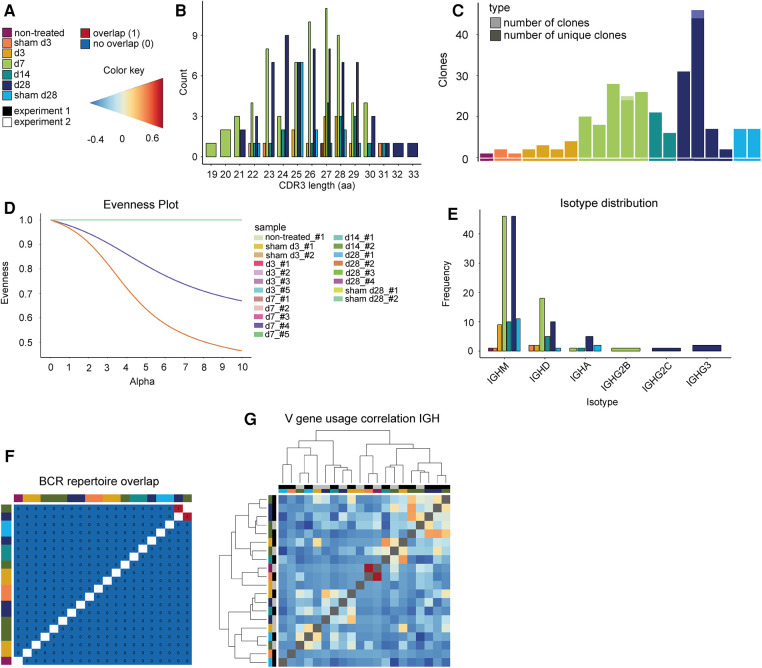
Figure 5.
Elastase-induced AAA shows no BCR clonality. (A) Legend and color code. (B) Histogram indicating the CDR3 length distribution of the BCRs (paired chains). The proportion is plotted against the amino acid (aa) CDR3 length. The color indicates whether the TCRs belong to an aorta isolated at days 3, 7, 14, or 28 after PPE or sham surgery or to a non-treated aorta. (C) Barplot displaying the number of all BCR clones (pale color) and only unique clones (vibrant color) per mouse. Almost all BCR clones are unique. (D) Evenness plot indicating the extent of clonal expansion for every sample. (E) Barplot indicating the isotype distribution of the BCR heavy chain (IGH) in the different conditions. The most frequent isotypes for all conditions are IGM and IGD. (F) BCR repertoire overlap is displayed in a heatmap. The color bars on the top and left side of the heatmap indicate the time point. (G) Heatmap presenting the Spearman correlation and hierarchical clustering of the BCR heavy chain (IGH) V-gene usage of the different samples. The color gradient indicates the level of correlation (blue = weak correlation, red = strong correlation). The color bars on the top and left side of the heatmap indicate the experiment and the time point.

