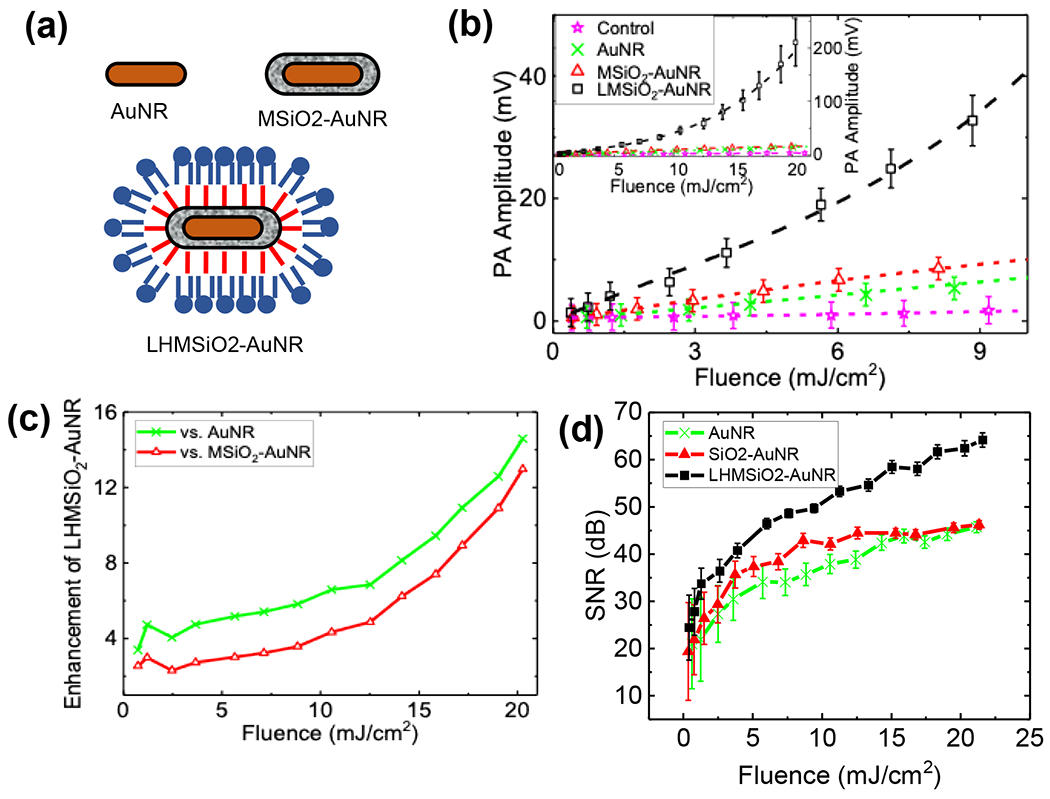
Figure 3.

(a) Cartoon schematic of structures tested. (b) PA peak-to-peak amplitude (Vpp) as a function of laser fluence recorded for AuNR (green cross), MSiO2–AuNR (red triangles), and LHMSiO2–AuNR (black squares) particles in water. Signal from the control (PE tube filled with water) is displayed in magenta stars. All particle concentrations were 0.45 nM. Inset shows the results for a wider fluence range. Error bars show one standard deviation in both directions to the mean Vpp; all samples were run in triplicate. The connecting dashed lines show linear fits for AuNR in green, MSiO2–AuNR in red and for control in magenta. A third order polynomial fit for LHMSiO2–AuNR is displayed in black dashed line. Student’s t-test for significance showed p < 0.05 for LHMSiO2-AuNR vs. MSiO2-AuNR at all fluences tested. (c) Enhancement in PA response of LHMSiO2-AuNR vs AuNR (green cross) and MSiO2-AuNR (red triangles) as a function of laser fluence obtained by dividing corresponding amplitudes in Vpp. (d) Signal-to-noise ratios (SNRs) of each sample tested vs. laser fluence. The error bars represent the propagated standard deviations of the signal and noise.
