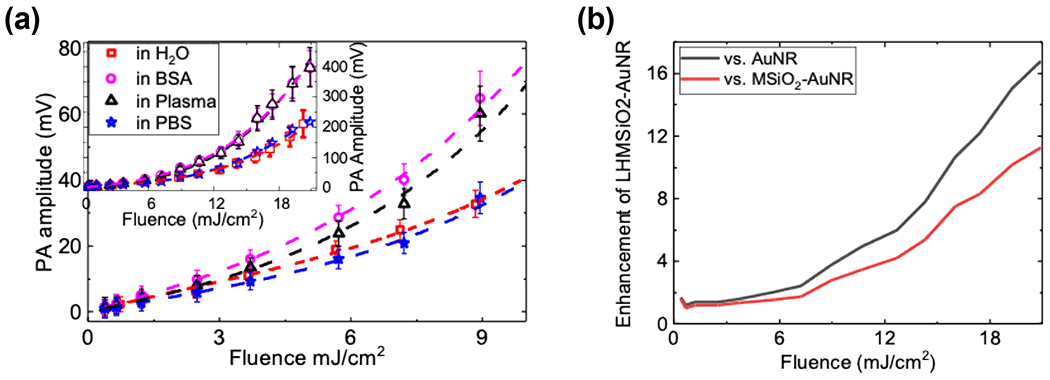
Figure 5.

PA response (Vpp) plotted as a function of laser fluence for LHMSiO2-AuNR sample dispersed in water showed in red filled squares; in Bovine Serum Albumin (BSA) displayed in magenta circles; in human plasma (HPL) displayed in black triangle; and in phosphate buffer solution (PBS) displayed in blue star. Dotted lines are from a 3rd order polynomial fit. The inset shows the same results for an extended range of fluences. Error bars show one standard deviation above and below the mean value.
