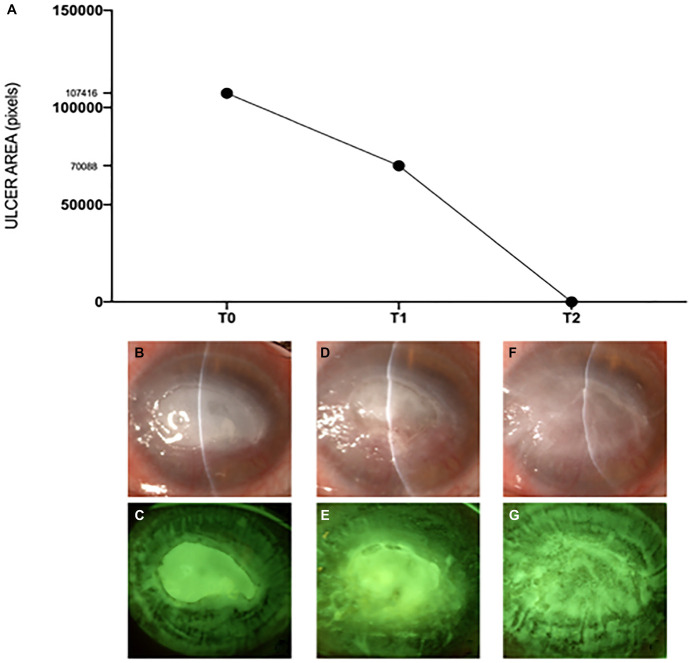
FIGURE 2.
Course over time of the corneal disease. A, Graph representing the changes of the area of the epithelial defect (expressed in pixels) for each time point (T0, T1, and T2) that was digitally analyzed using the public domain software ImageJ 1.53t (National Institutes of Health, Bethesda, MD). B and C, Slitlamp photographs of the cornea with and without blue/yellow filters at T0. D and E, Slitlamp photographs of the cornea with and without blue/yellow filters at T1. F and G, Slitlamp photographs of the cornea with and without blue/yellow filters at T2.

