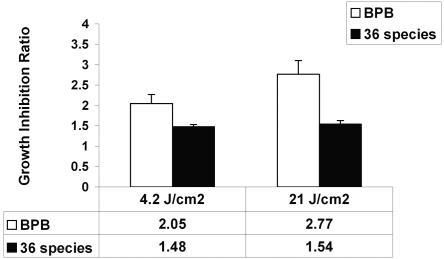
FIG. 6.
Suppression of the BPB group (four species) and that of 36 other microorganisms after exposure of dental plaque to light. The bars represent the mean growth inhibition ratios (ratios of DNA counts before exposure to light to those after exposure to light) obtained from 15 patients (data from each patient were representative of three independent experiments), and the error bars represent the standard error of the mean.

