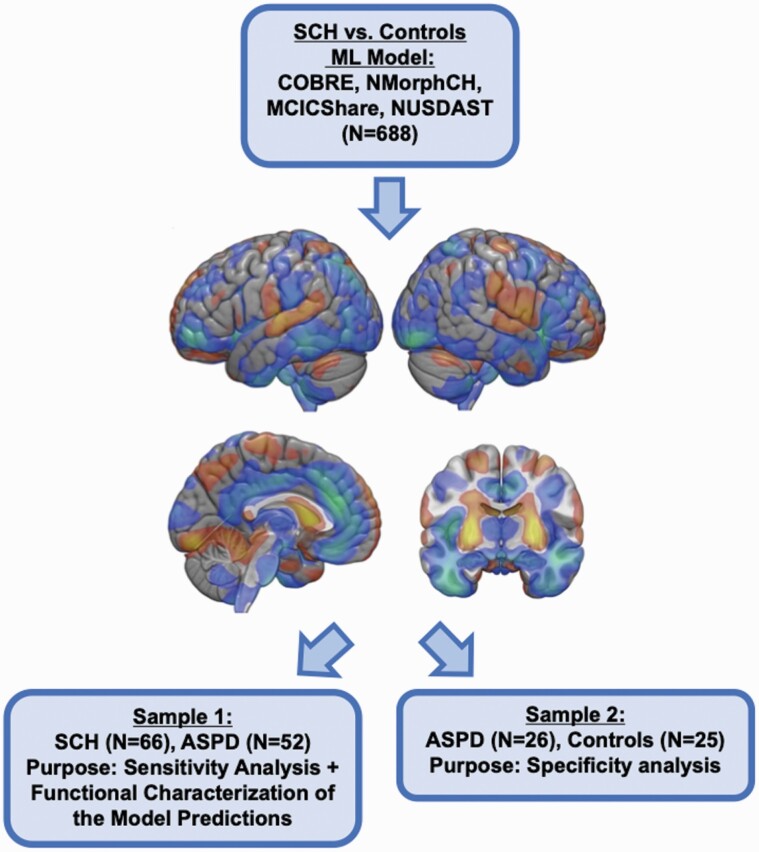
Fig. 1.
Flowchart describing the analyses of the study. Training the schizophrenia vs. controls machine learning model using discovery samples. The SCH vs. Controls ML model is visualized as an SVM weight map (thresholded at 0.0005 for visualization purposes). Warm colors indicate gray matter volume increases, and cold colors decrease in the VBM data. The trained ML model was then applied, without any in-between-retraining, to samples 1 and 2.

