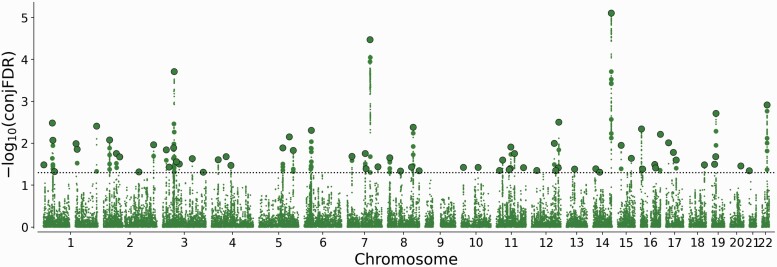
Fig. 2.
“ConjFDR Manhattan plot” showing common genetic variants jointly associated with schizophrenia and vitamin D levels at conjunctional false discovery rate (conjFDR) < 0.05. The y-axis shows the −log10 transformed conjFDR. Chromosomal position is presented along the x-axis. The threshold for significant shared associations (conjFDR < 0.05) is represented by the horizontal dotted line. Independent SNPs are indicated by a black perimeter.

