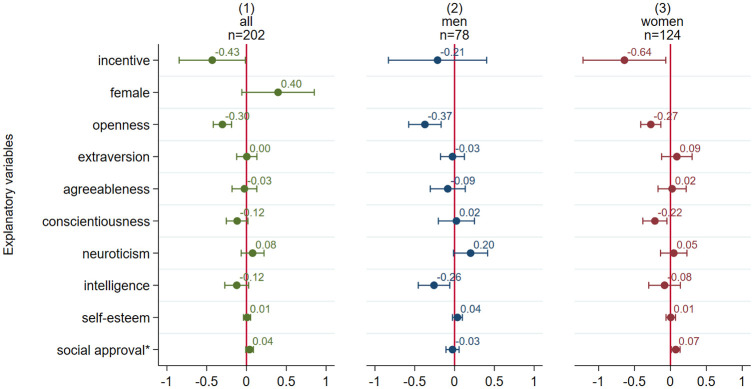
Fig 3. Coefficient plot of individual characteristics on the number of conforming answers (OLS regression).
Note: N = 202. Unstandardized coefficients of multiple linear OLS regressions including robust 95% confidence intervals. Poisson and negative binomial models do not alter the results in any substantial way. Variables marked with an ‘*’ indicate statistically significant differences in the coefficients between models (2) and (3).

