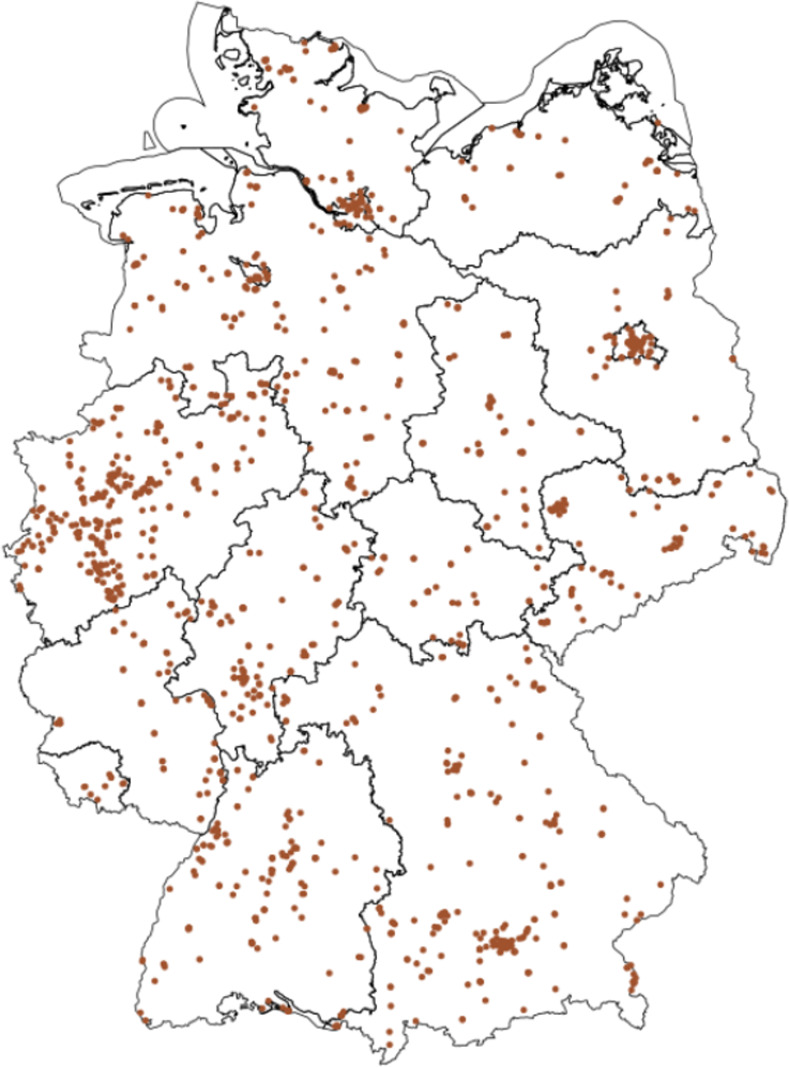
Fig 2. Geographic distribution of genotyped households in the SOEP-G sample.

Note: Own illustration based on spatial datasets from Reference [29] under data license Germany–attribution–Version 2.0 dl-de/by20 (https://www.govdata.de/dl-de/by-2-0).

Note: Own illustration based on spatial datasets from Reference [29] under data license Germany–attribution–Version 2.0 dl-de/by20 (https://www.govdata.de/dl-de/by-2-0).