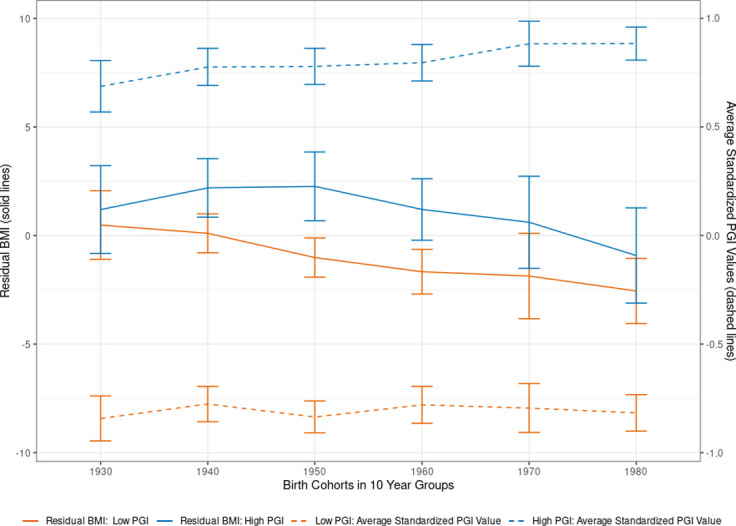
Fig 5. Body mass index (BMI) by birth cohort and PGI values.

Note: Using the single-trait polygenic index (PGI) for BMI, we split the sample of adults (older than 20 years) into two parts at the median PGI value (High PGI: N = 683; Low PGI: N = 775). Self-reported BMI is residualized for sex and survey year before being averaged across survey waves. Each individual is assigned to a decadal cohort. Individuals born before between 1923 and 1939 are all in the 1930s cohort, while individuals born after 1980 are all in the 1980 group. Individuals born between 1940–1949, 1950–1959, 1960–1969, and 1970–1979 are labeled as 1940s, 1950s, 1960s, and 1970s respectively. We plotted the average observed residual BMI for each decadal cohort by PGI bin and 95% confidence intervals.
