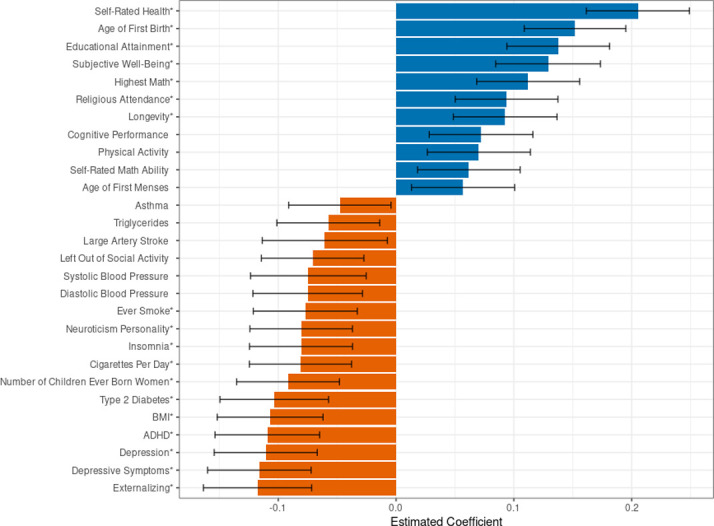
Fig 6. Associations between polygenic indices and self-rated health.

Note: Analyses in the SOEP-G sample, N = 2,060. Self-rated health is measured by a 5-point Likert scale where a 1 indicates poor health and a 5 indicates very good health. Each self-rated health observation is regressed on five-year age-bin dummies, sex dummies, and the interaction of sex and age-bin dummies. We take the estimated residual from the previous regression, compute the average residual value for each individual, and regress each PGI along with 20 genetic principal components on these residuals where each individual has one observation. The estimated standardized betas from each PGI are reported in the figure. The figure represents 28 single-trait PGIs with an effect size greater than |±0.1|, out of 55 single-trait PGIs overall. PGIs marked with an * are statistically distinguishable from zero after a Bonferonni correction. Error bars represent a 95% confidence interval around the estimated beta for each PGI.
