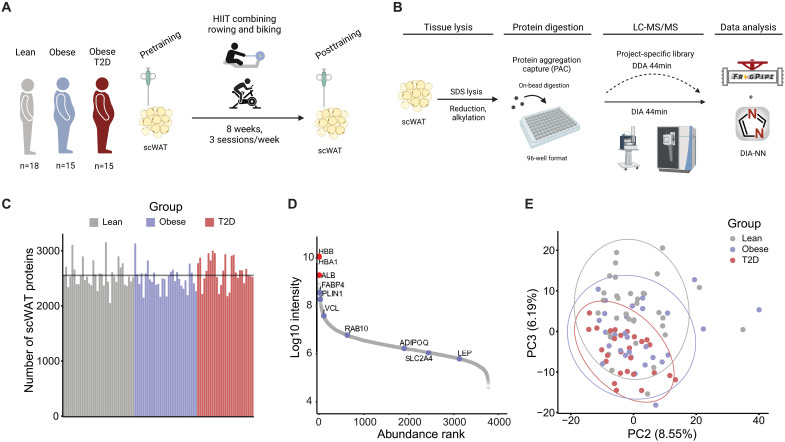
Fig. 1. High-throughput proteome analysis of human scWAT.
(A) Graphic illustration of the study design. (B) Proteomics workflow from sampling and lysis of scWAT to analysis. (C) Number of scWAT proteins quantified per sample in each of the three groups. (D) Dynamic range plot of ranked protein abundance (log10 intensity) showing relevant adipocyte-specific markers (blue dots) and blood contaminants (red dots). (E) Principal component (PC) analysis plot of component 2 (x axis) and component 3 (y axis). Dots are colored by group.

