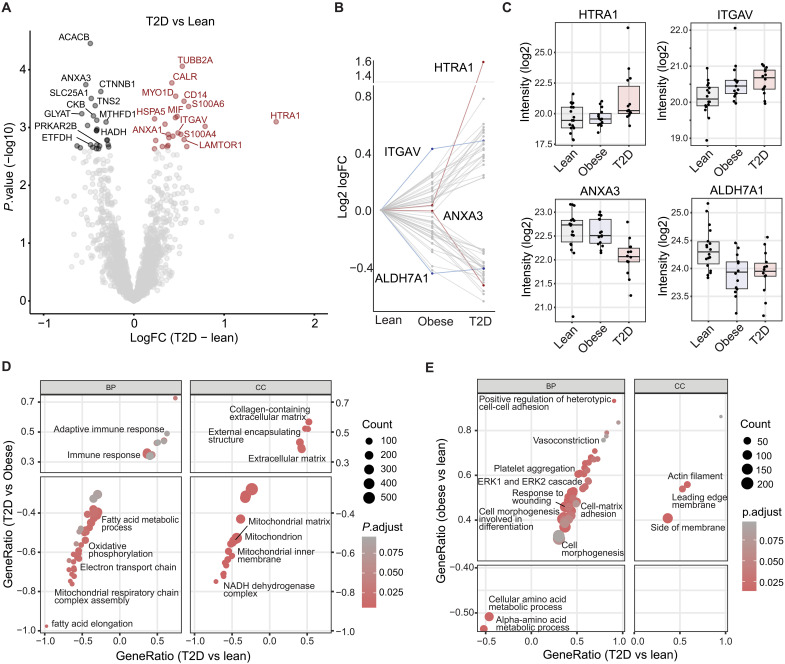
Fig. 2. Baseline proteome differences in scWAT from lean, obese, and T2D individuals.
(A) Volcano plot showing baseline (pre) comparison of the WAT proteome between T2D and lean individuals (FDR < 10%). Most regulated proteins are highlighted. (B) Profile plot of significant T2D-lean regulated proteins. Dots connected by a line represent the profile of protein. Proteins with a distinct profile are highlighted in red and blue. (C) Boxplot of highlighted proteins with distinct profile curves between groups. (D and E) GO biological processes (GOBP) and cellular components (GOCC) enrichment analysis. Gene ratios of overlapping terms between T2D-obese (B), obese-lean (C) (y axis), and T2D-lean (x axis) are shown. Dots are colored by adjusted P value and size is based on the number of proteins in the enriched category.

