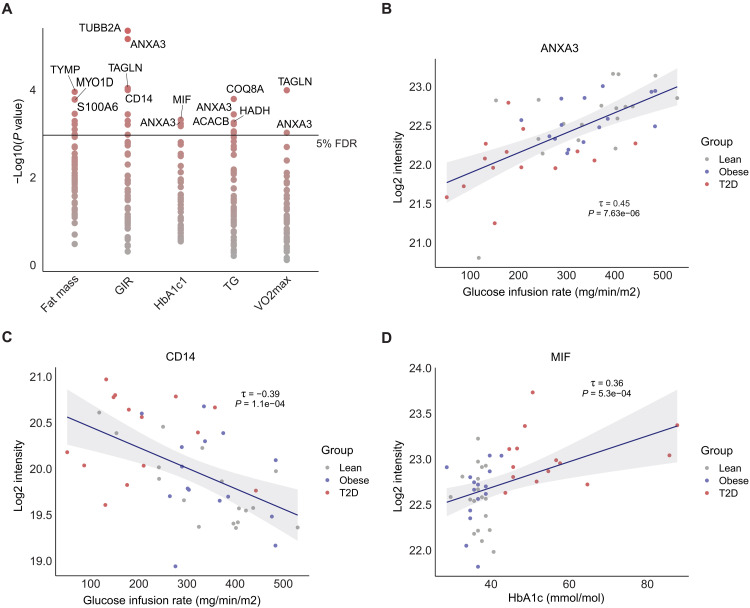
Fig. 3. Correlation of clinical parameters with scWAT proteins.
(A) Correlation analysis of significantly regulated proteins at baseline with five clinical parameters. −Log10 (P value) on y axis. Most significant proteins are highlighted. (B and C) Kendall’s rank correlation of ANXA3 and CD14 protein abundance (log2 intensity, y axis) and GIR (mg/min/m2). (D) Kendall’s rank correlation of MIF and HbA1c (mmol/mol). Kendall’s τ coefficient and P value are shown.

