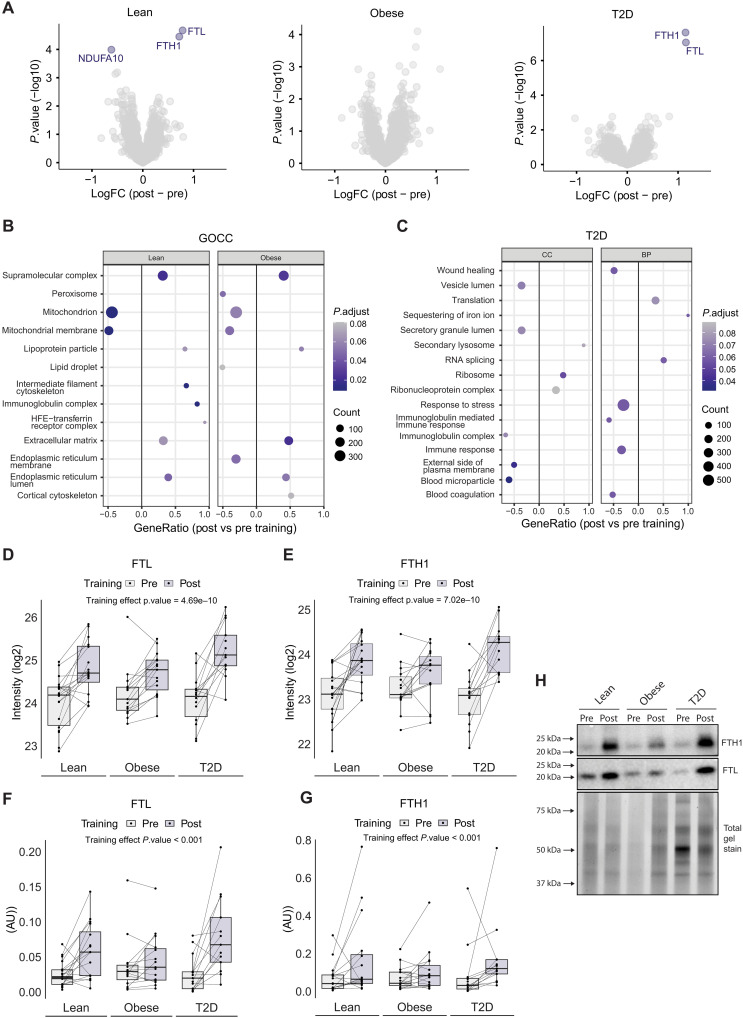
Fig. 4. Effects of exercise training on the human scWAT.
(A) Volcano plot of group-wise log2 fold changes post- versus pretraining. Significant proteins are highlighted (FDR < 10%). (B) Selected representative GOCC terms significantly changing with exercise training in the lean and obese group. (C) Selected representative GOCC and GOBP terms significantly changing with exercise training in the T2D group. (D and E) Boxplot of FTL and FTH1 protein abundance (log2 intensity) in human scWAT pre/post exercise training. (F and G) Boxplot of FTL and FTH1 protein abundance (arbitrary unit) obtained from Western blot analysis in human scWAT pre/post exercise training. (H) Representative immunoblots from Western blot analysis.

