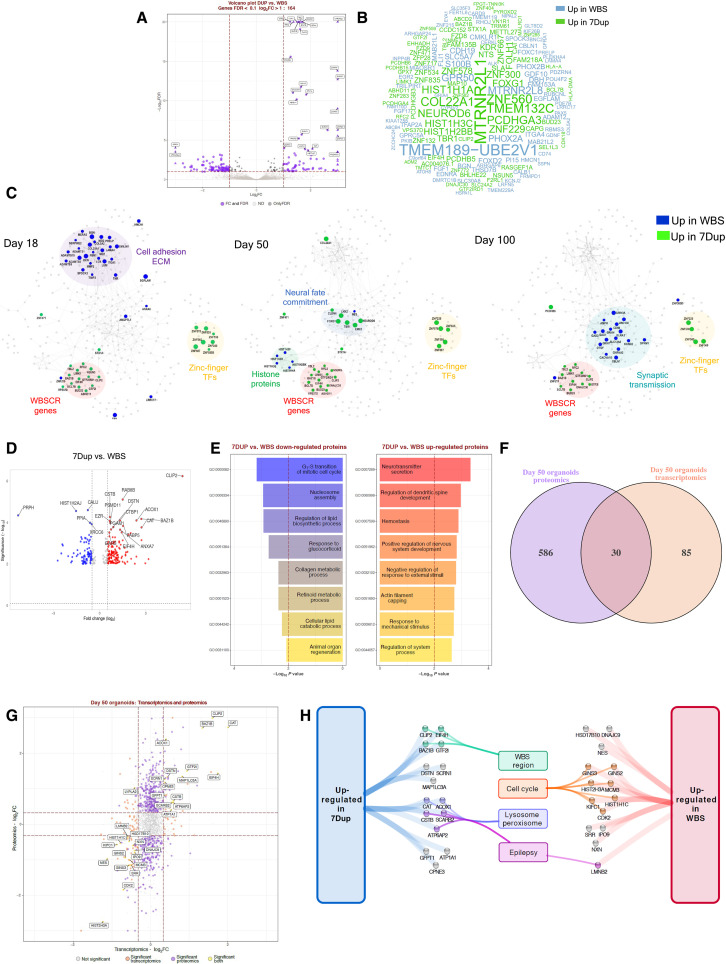
Fig. 2. Transcriptomic and proteomic profiling of 7q11.23 CNV COs reveal imbalances in proliferative vis-a-vis neurogenic programs.
(A) DEA for 7Dup versus WBS COs. Plots report tested genes as −log10 FDR and log2FC. Purple indicates significantly modulated genes (FDR < 0.1 and absolute log2FC > 1), black indicates genes passing FDR threshold, and gray indicates not significant. Top 30 genes are highlighted. (B) Word cloud reporting DEGs gene symbol; word size represents fold change magnitude, green represents up-regulated in 7Dup, and blue represents up-regulated in WBS. (C) STRING-based network reconstructed for modulated genes (FDR < 0.1, log2FC > 1) in at least one time point by stage-wise DEA. Each visualization highlights the most relevant findings for the reported time point. Node size and color: magnitude and direction of log2FC at the specified stage, green denotes up-regulation in 7Dup, and blue denotes up-regulation in WBS. Functionally relevant regions are highlighted. (D) Differentially expressed proteins (DEP) comparing 7Dup and WBS COs, (one CO per line and three lines per genotype in duplicate). DEP cutoff: FDR < 0.01 and FC > 1. (E) Top 8 enriched biological processes for up-regulated (P < 0.05, FC > 2) and down-regulated (P < 0.05, FC < −2) proteins from 7Dup versus WBS at day 50. (F) Overlap between transcriptomics and proteomics in 7Dup versus WBS at day 50. Features are selected as modulated with a P < 0.05 and absolute log2FC > log2(1.25). (G) Relationship of the fold change in 7Dup versus WBS in the proteome (y axis) and transcriptome (x axis) for genes tested by both approaches. Yellow indicates features modulated in both modalities; they are all modulated in the same direction except LYPLA2. Purple represents DEPs absent among DEGs, and orange represents DEGs absent among DEPs. (H) Manually curated functional annotation for genes modulated in the same direction at the transcript and protein level.

