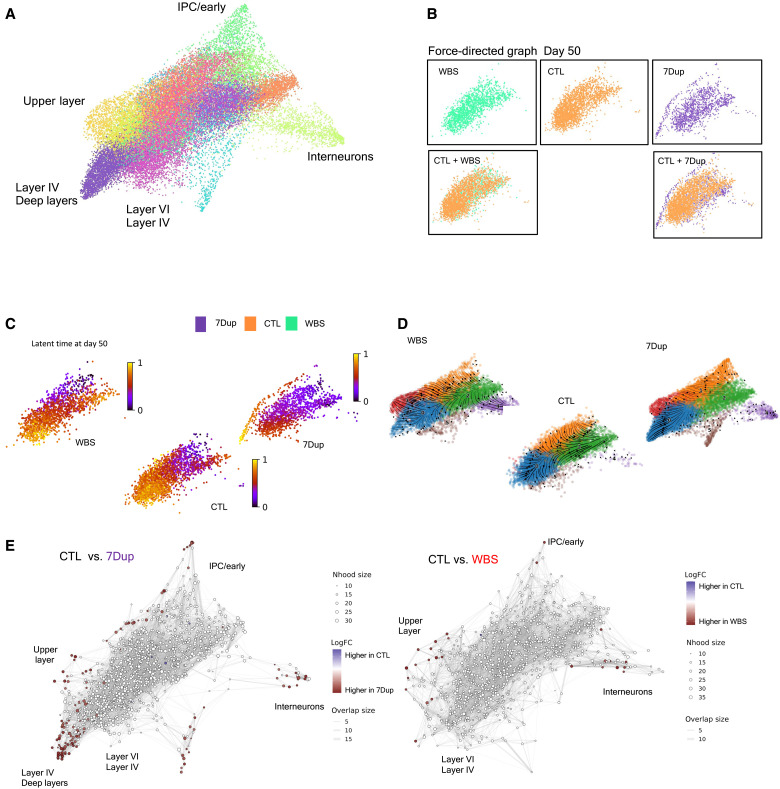
Fig. 3. Gene dosage imbalances at 7q11.23 accelerate neuronal differentiation in 7Dup COs.
(A) Force-directed graph drawing of only the EN2/IN populations (recalculating neighbors and distances subselecting only EN2/IN populations), divided in subclusters and manually annotated. This dimensionality reduction highlights the most differentiated cell population (the pointed extremity of the graph, manually annotated). (B) Differences in cell distribution in force-directed graph for day 50 organoids. WBS and CTL occupy the same space, while 7Dup has more mature cells. (C) Latent time calculated only on the EN2 and IN populations at day 50. The starting cell is identified considering the total population. (D) Representation of the EN2 and IN populations developmental path in the three genotypes in force-directed graph, overimposed with RNA velocity. (E) Differential abundance of cells in different areas of the force-directed graph. The nodes are neighborhoods of cells aggregated based on RNA expression similarity, while graph edges depict the number of cells connected between adjacent neighborhoods. White nodes are neighborhoods that are not detected as differentially abundant (FDR > 1%), red dots, on the other end, are significant (FDR < 1%).

