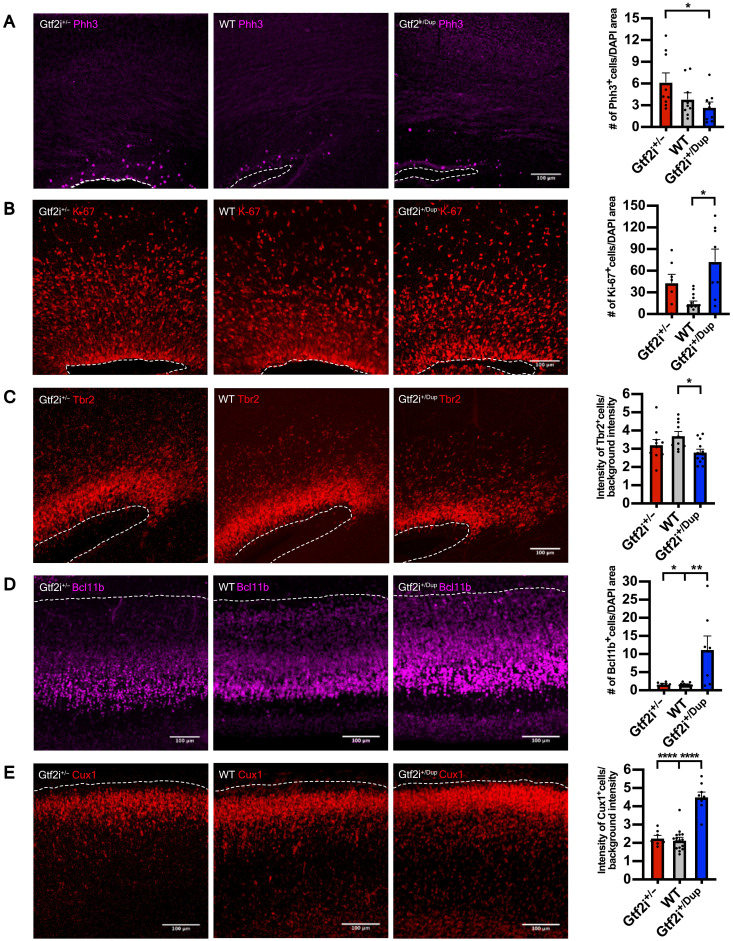
Fig. 5. Gtf2i dosage drives accelerated neuronal differentiation in the mouse developing cortex.
(A) Left: Representative images of mitosis marker Phh3 expression in Gtf2i+/−, WT, and Gtf2i+/Dup E17.5 embryos. Right: Quantification of Phh3 expression at E17.5 in the three genotypes. Gtf2i+/−, n = 9 sections from six mice; WT, n = 9 sections from five mice; Gtf2i+/Dup, n = 9 sections from five mice. (B) Left: Representative images of cell cycle marker Ki-67 expression. Right: Scatter plot with bar quantifying the Ki-67 expression at E17.5. Gtf2i+/−, n = 7 sections from four mice; WT, n = 13 sections from eight mice; Gtf2i+/Dup, n = 8 sections from four mice. (C) Left: Representative images of intermediate progenitor marker Tbr2. Right: Scatter plot with bar quantifying Tbr2 expression at E17.5. Gtf2i+/−, n = 11 sections from six mice; WT, n = 10 sections from five mice; Gtf2i+/Dup, n = 12 sections from five mice. (D) Left: Representative images of lower layer cortical neuronal marker Bcl11b. Right: Scatter plot with bar quantifying Bcl11b expression at E17.5. Gtf2i+/−, n = 7 sections from four mice; WT, n = 16 sections from eight mice; Gtf2i+/Dup, n = 8 sections from four mice. (E) Left: Representative images of upper layer cortical neuronal markers Cux1. Right: Scatter plot with bar quantifying Cux1 expression at E17.5. Gtf2i+/−, n = 7 sections from four mice; WT, n = 16 sections from eight mice; Gtf2i+/Dup, n = 8 sections from four mice. All data are shown as means ± SEM. Statistical analyses were performed using one-way ANOVA, followed by Tukey’s multiple comparisons test. Significance level was set to P < 0.05. *P < 0.05, **P < 0.01, and ****P < 0.0001.

