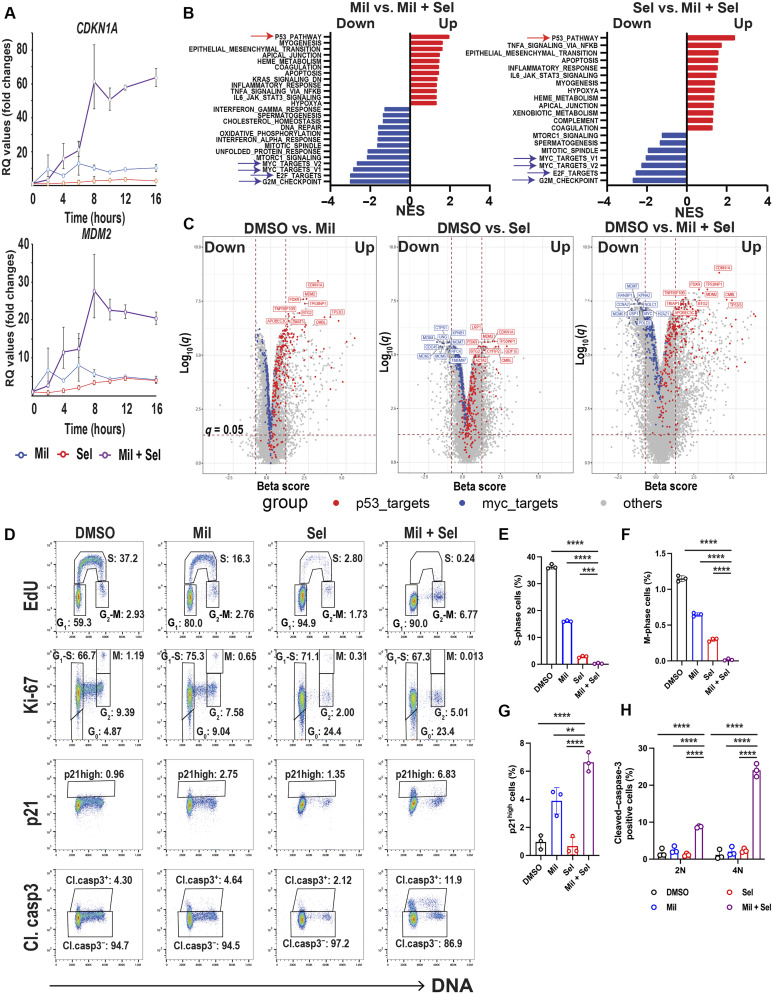
Fig. 2. Dual MDM2/XPO1 inhibition enhances p53 target transcription and dysregulates MYC transcriptional program, leading to cell cycle arrest.
(A) Relative quantitation (RQ) values by quantitative PCR for CDKN1A and MDM2 in OCI-AML3 cells treated with Mil, Sel, or Mil + Sel for the indicated time points. (B) Pathway analyses comparing Mil versus Mil + Sel and Sel versus Mil + Sel in RNA-seq in OCI-AML3 cells treated with Mil, Sel, or Mil + Sel for 12 hours. The top up-regulated and down-regulated pathways are indicated by red and blue arrows, respectively. NES, normalized enrichment score. (C) Volcano plots [beta score (magnitude) and q values (significance, −log10 scale)] from differential gene expression profiles in RNA-seq from OCI-AML3 cells DMSO versus Mil (left), Sel (middle), and versus Mil + Sel (right). The top 10 up-regulated TP53 targets and down-regulated MYC targets are indicated with red and blue colors, respectively. The remaining genes are indicated in gray. (D) Cell cycle analyses using multiparameter flow cytometry with Ki-67, p21, and cleaved caspase-3 in OCI-AML3 cells treated with Mil, Sel, or Mil + Sel for 24 hours. Caspase-3–negative cells were gated for EdU, Ki-67, and p21 panels. (E and F) Change in the percentages of cells in S (E) and M (F) phases in OCI-AML3 cells in indicated treatments. (G) The percentages of “p21 high” OCI-AML3 cells [rectangles shown in the third row of (D)] in indicated treatments. (H) Change of cell percentages of cleaved caspase-3–positive OCI-AML3 cells [rectangles shown in the fourth row of (D)] in indicated treatments for G1 (2N) and G2-M (4N) phases. A Mil and Sel concentration of 160 nM was used. **P < 0.01; ***P < 0.001; ****P < 0.0001.

