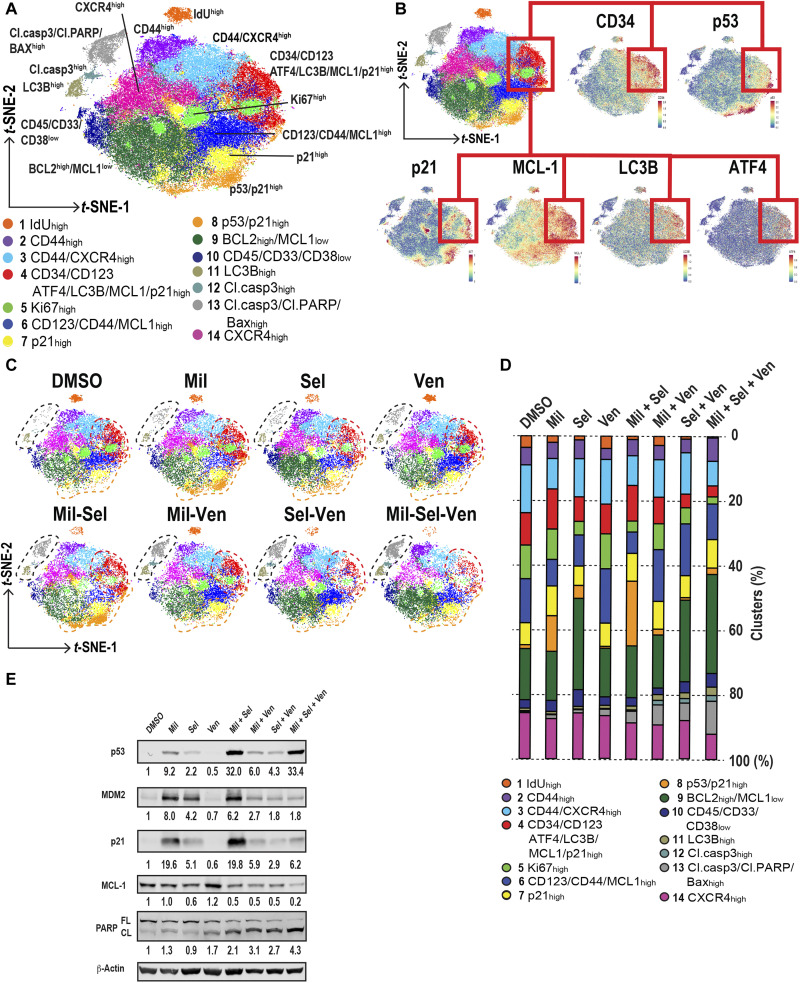
Fig. 6. Triple inhibition of MDM2, XPO1, and BCL2 induces apoptosis in p53 reactivation–responsive persistent AML cells with increased MCL1 along with stress responses.
(A) t-distributed stochastic neighbor embedding (t-SNE) plots generated by unsupervised clustering and dimension reduction using RphenoGraph. Clusters are annotated by numbers with distinct colors. (B) The t-SNE plot shown in (A) along with marker expression plots by t-SNE for CD34, p53, p21, MCL1, LC3B, and ATF4. Cluster 4 is connected by red lines and rectangles. (C) t-SNE plots of samples treated with each indicated treatment. Clusters 11, 12, and 13; cluster 4; and cluster 8 are circled by black, red, and orange dashed lines, respectively. (D) Proportions of each cluster in each sample with the indicated treatment in 195Pt-negative live cells. The colors correspond with the ones in the t-SNE plot shown in (A). (E) Immunoblots of indicated proteins collected from OCI-AML3 cells with indicated treatments (100 nM of Mil, Sel, and/or Ven for 24 hours).

