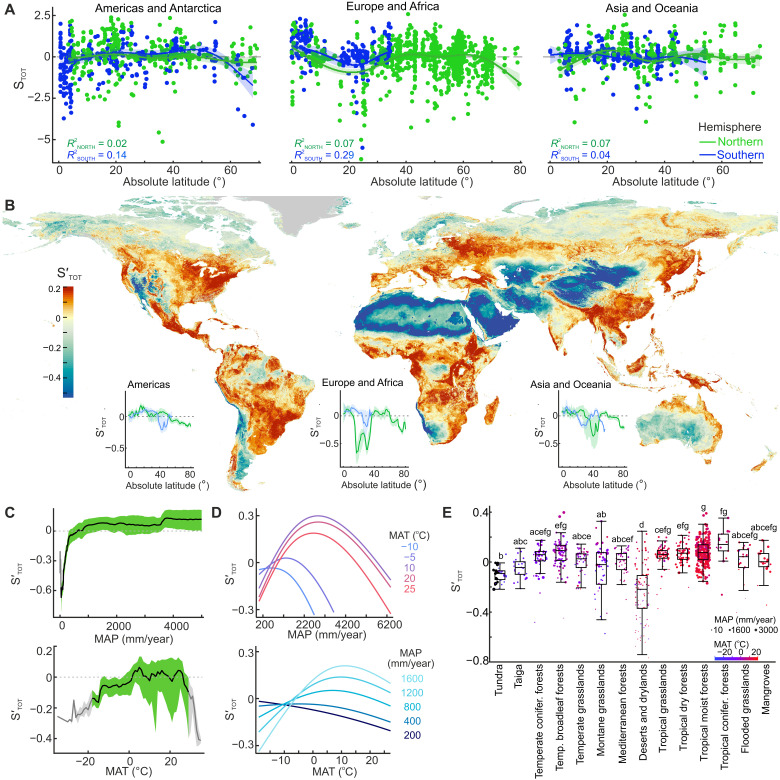
Fig. 1. Global distribution of soil fungal alpha diversity.
(A) Latitudinal distributions of total fungal alpha diversity (STOT). (B) Consensus map of predicted total fungal alpha diversity (S′TOT), with insets showing S′TOT latitudinal distributions in Northern (green) and Southern (blue) Hemispheres; areas covered with perennial ice are colored in gray. (C) S′TOT (median and interquartile range) distribution in the global gradients of MAP and MAT; green and gray denote the predictions within and beyond training data coverage, respectively. (D) Conditional effects of MAP and MAT on S′TOT. (E) S′TOT across terrestrial biomes, with dots showing median S′TOT for 818 terrestrial ecoregions (47). Biomes sharing the same letter indicate no significant difference at the 5% level of significance after P value adjustment with the Holm-Bonferroni method.

