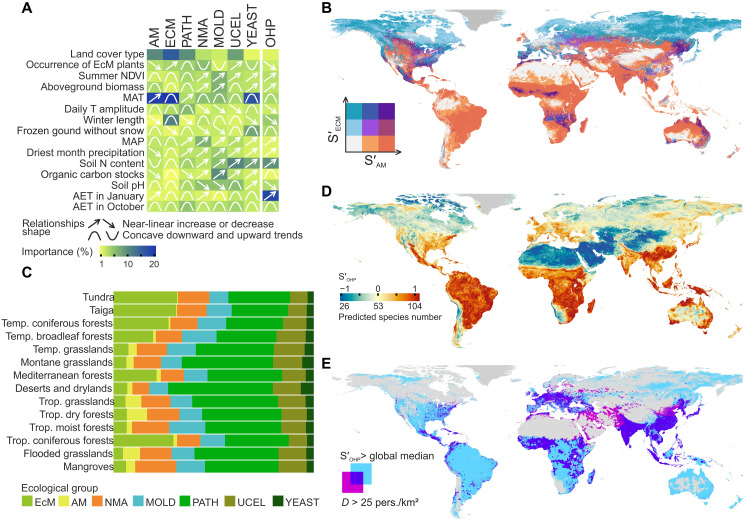
Fig. 2. Alpha diversity of soil fungal ecological groups.
(A) Importance of key predictors and the shape of their relationships with the local richness of fungal ecological groups. (B) Model-predicted global distribution of EcM and AM fungal local richness. Color legend denotes low, medium, and high EcM or AM fungal predicted richness; areas covered with perennial ice are colored in gray. (C) Functional profiles of soil mycobiota in different biomes based on predicted alpha diversity of fungal ecological groups. (D) Global distribution of predicted alpha diversity of OHP fungi and (E) overlap between areas with high predicted richness of OHP fungi and high human population density (D).

