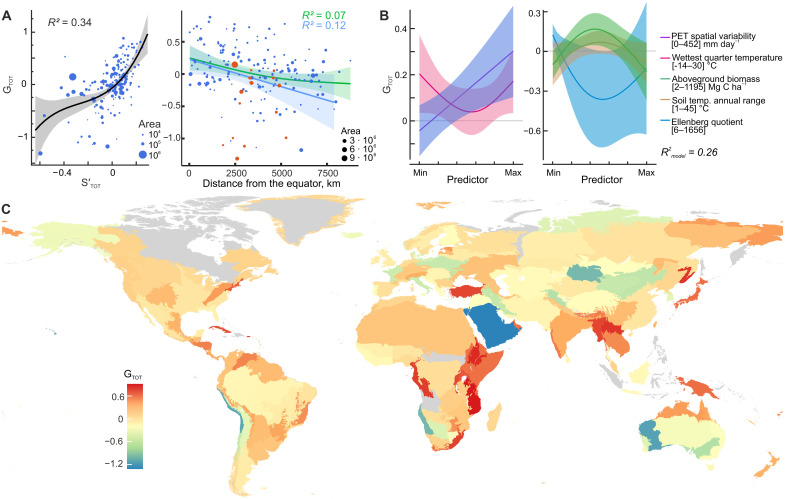
Fig. 5. Gamma diversity of soil fungal communities.
(A) Relationships of total fungal regional richness (GTOT) with median STOT and distance from the equator. Separate regression lines are shown for the Northern (green) and Southern (blue) Hemispheres. Deserts and drylands (red dots) are excluded from the regression analysis. (B) Marginal effects of the significant predictors on GTOT. Potential evapotranspiration (PET) spatial variability is the interquartile range of Thornthwaite’s PET, and the Ellenberg quotient, the ratio of mean temperature of the warmest month to annual precipitation, is an index of drought. (C) Map of GTOT at the ecoregion scale (46).

