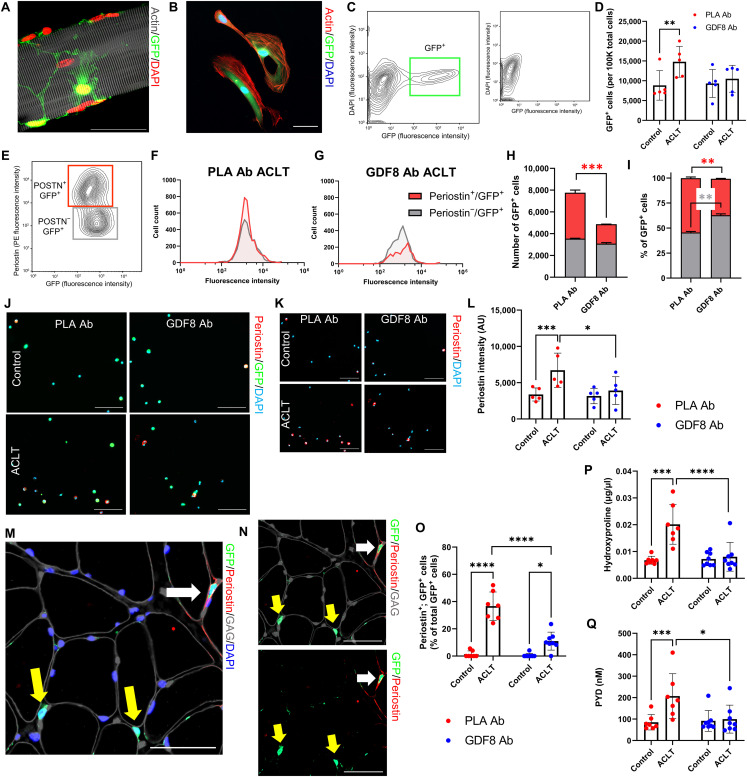
Fig. 3. Treatment with anti-GDF8 antibody reduces muscle fibrogenic cell expansion and fibrosis following ACL injury.
(A and B) Representative images demonstrating Col1-GFP+ cells on (A) a muscle fiber and (B) following FACS isolation. Scale bars, 50 μm. (C) Representative FACS plot indicating muscle Col1-GFP+ cells; small inset indicates GFP+ cell absence in wild-type mice. (D) ACLT increases quadriceps Col1-GFP+ cell abundance in PLA Ab–treated mice (drug × injury interaction, P = 0.029). (E) Col1-GFP+ cells were gated by periostin expression level. (F and G) Representative histograms demonstrating periostin cell counts and GFP fluorescence intensity in ACLT limbs of PLA Ab– and GDF8 Ab–treated mice. (H and I) GDF8 Ab treatment lowers (H) raw and (I) relative cell abundance of periostin+; Col1-GFP+ cells in the ACLT quadriceps [drug × cell type interaction, P = 0.012 for both (H) and (I)]. (J and K) Representative images of isolated Col1-GFP+ cells stained for periostin. Scale bars, 100 μm. (L) GDF8 Ab treatment attenuates elevated periostin intensity in Col1-GFP+ cells 1 week after ACLT (drug × injury interaction, P = 0.011). (M and N) Representative IHC images denoting periostin, Col1-GFP, glycosaminoglycans (GAG), and 4′,6-diamidino-2-phenylindole (DAPI) in ACLT-injured quadriceps. White arrow: periostin+; Col1-GFP+ cell; yellow arrows: periostin−; Col1-GFP+ cells. Scale bars, 50 μm. (O) GDF8 Ab treatment attenuates elevated frequency of quadriceps periostin+; Col1-GFP+ cells 1 week after ACLT (drug × injury interaction, P < 0.001). (P and Q) GDF8 Ab treatment rescues elevated (P) hydroxyproline abundance and (Q) pyridinoline (PYD) cross-linking in quadriceps muscle post-ACLT [drug × injury interaction, P = 0.002 for both (P) and (Q)]. N = 2 mice per group (E to I), 5 mice per group (C, D, and J to L), and 7 to 8 mice per group (M to Q). *P < 0.05, **P < 0.01, ***P < 0.005, and ****P < 0.001 represent Šidák’s multiple comparison post hoc tests performed when significant interactions were detected via mixed models. POSTN, periostin.

