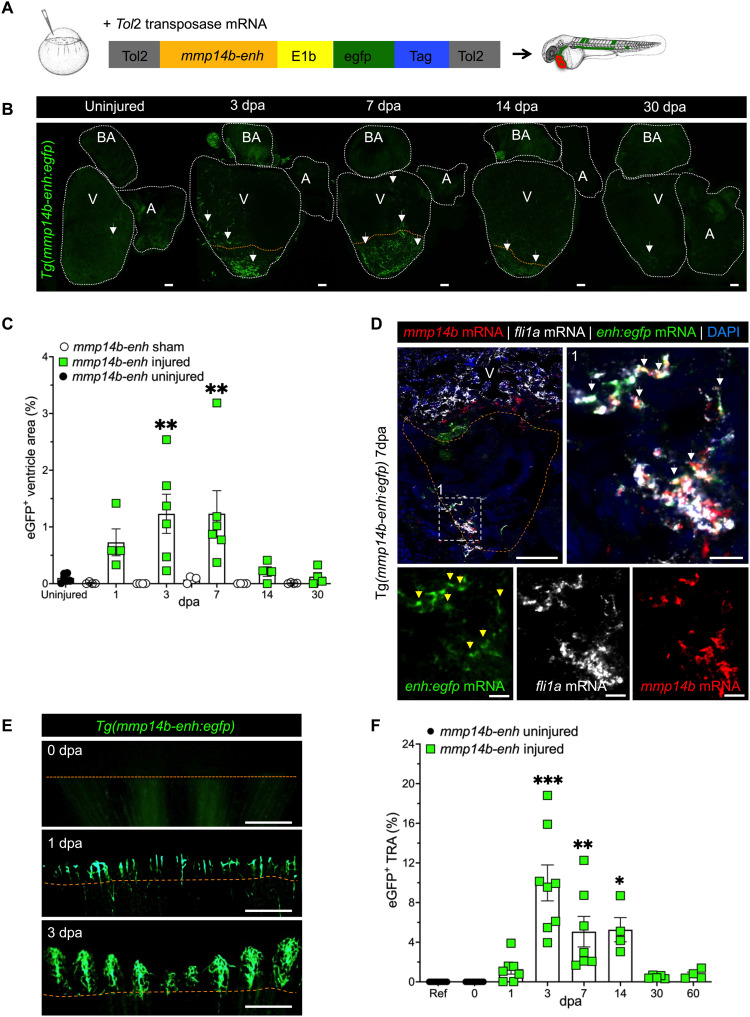
Fig. 3. Identification of an injury-responsive mmp14b endothelial enhancer.
(A) Schematic depicting generation of Tg(mmp14b-enh:egfp) zebrafish. (B) Representative whole-mount views of dissected Tg(mmp14b-enh:egfp) zebrafish hearts showing eGFP fluorescence in the vasculature at 3, 7, 14, and 30 dpa, compared to the background fluorescence in the uninjured heart (n = 9). White dashed lines outline the heart. Arrows highlight eGFP fluorescence in coronary endothelial cells. (C) Quantification of eGFP+ cells in Tg(mmp14b-enh:egfp) zebrafish in uninjured (black circles), sham-operated (open circles), and amputated (green squares) zebrafish ventricles at 1 to 30 dpa. (D) RNAscope in situ hybridization on frontal sections of Tg(mmp14b-enh:egfp) hearts at 7 dpa for mmp14b (red), egfp (green), and the endothelial marker fli1a (orange) (white arrowheads). Box 1 (white dashed line) represents the enlarged area to the right and in lower panels, which show individual color channels. (E) Fluorescent images of the caudal fin of Tg(mmp14b-enh:egfp) zebrafish at 0, 1, and 3 dpa show vascular-specific eGFP expression in newly formed vessels proximal to the amputation plane. (F) Vessel density in the total regenerated area (TRA) following caudal fin amputation from 0 to 60 days in Tg(mmp14b-enh:egfp) zebrafish (green squares). Uninjured Tg(mmp14b-enh:egfp) zebrafish (black circles) are shown as a reference. Orange dashed line approximates the amputation plane. Scale bars, 100 μm [(B) and (D)], 20 μm (D1), and 400 μm (E). Statistical significance was determined using one-way ANOVA with Tukey’s multiple comparisons test (C) or Dunnett’s test (F). *P < 0.05; **P < 0.01; ***P < 0.001.

