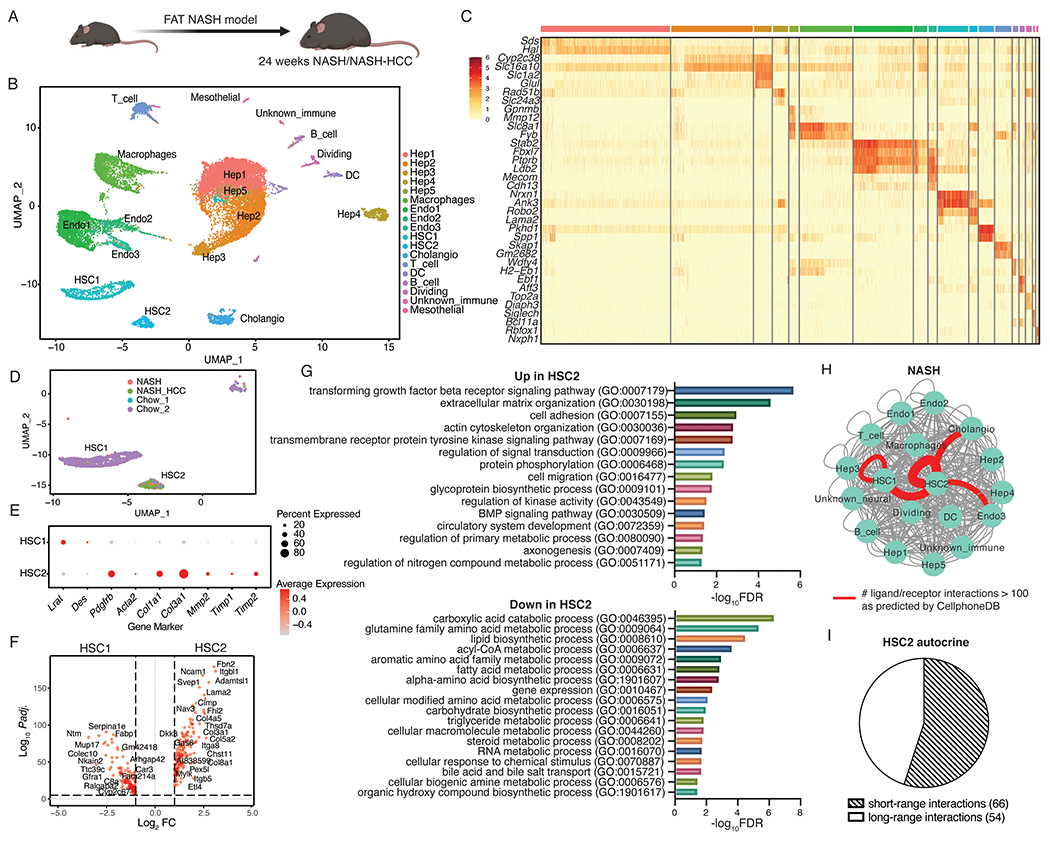
Figure 2. Autocrine signaling in NASH-associated hepatic stellate cells is conserved in FAT-NASH mice.

(A) Schematic of control (n=2), NASH (n=3), and NASH-HCC (n=3) mice used in this experiment. (B) UMAP visualization of nuclei combined from all liver samples colored by cell type. (C) Top 2 marker gene expression for each cell type. (D) UMAP visualization of hepatic stellate cell (HSC) clusters colored by sample origin. (E) Dot plot depicting canonical quiescence and activation marker gene expression for each HSC cluster. (F) Differentially expressed genes between HSC1 and HSC2 (red dots indicate DEG with Padj. < 0.05 and log2FC > 1). (G) All significantly enriched PANTHER pathways (FDR < 0.05) in genes up- and down-regulated in NASH-associated HSCs. (H) Total number of significant interactions between different cell types from NASH/NASH-HCC mice as predicted using CellphoneDB (P < 0.05). Thickness of the connecting line is proportional to the total number of interactions, with interactions > 70 highlighted in red. (I) HSC autocrine interactions classified as short-range or long-range based on manual curation.
