
Figure 3. Increased stellate cell-stellate cell contacts in FAT-NASH mice revealed by tissue-clearing and 3D imaging.
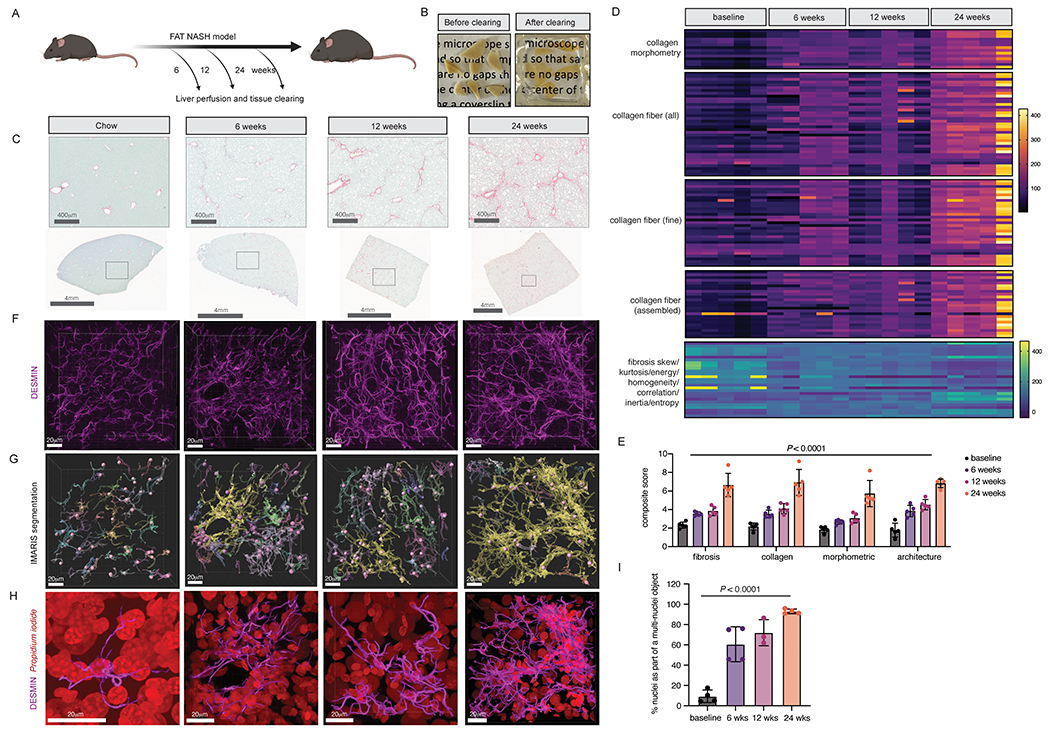
(A) Liver from FAT-NASH mice were perfused and cleared at the depicted timepoints. (B) Representative images of perfused liver pieces before and after clearing. (C) Representative images from Sirius red staining of FAT-NASH livers from different timepoints in the model. (D) AI-based quantification of Sirius red collagen staining from five mice per timepoint. (E) Composite fibrosis scores calculated based on (D). (F) Confocal imaging and 3D reconstruction of DESMIN staining in cleared livers. (G) IMARIS surface and spot segmentation of DESMIN and nuclear staining, respectively, of the same images from C. (H) Enlarged image of a single segmented DESMIN+ surface object highlighted in yellow in (G), along with nuclear staining in red. (I) Quantification of the percentage of nuclei that are found as a single nucleus per surface object or multiple nuclei per surface object (n=3-4 mice per timepoint).