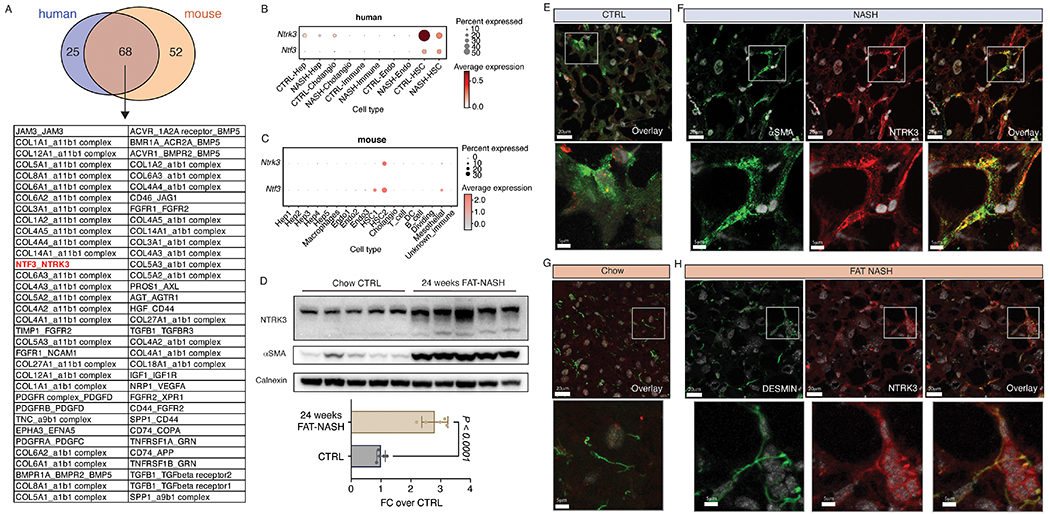
Figure 4. NTRK3 is expressed on cellular projections of NASH HSCs.

(A) Overlap of significant (P < 0.05) autocrine interactions identified in human and mouse NASH by CellphoneDB. Dot plot depicting NTRK3 gene expression across different cell types in human (B) and mouse (C) snRNA-seq data. (D) NTRK3 and αSMA protein expression in whole-liver lysates of control or 24-week FAT-NASH mice (n=5 mice per group, p-value calculated using Student’s t-test), as detected by Western blot and quantified by densitometry normalized to CALNEXIN as loading control. NTRK3 and αSMA protein expression in human control (E) and NASH (F) liver as detected by immunofluorescence. NTRK3 and DESMIN protein expression in mouse control (G) and NASH (H) liver as detected by immunofluorescence.
