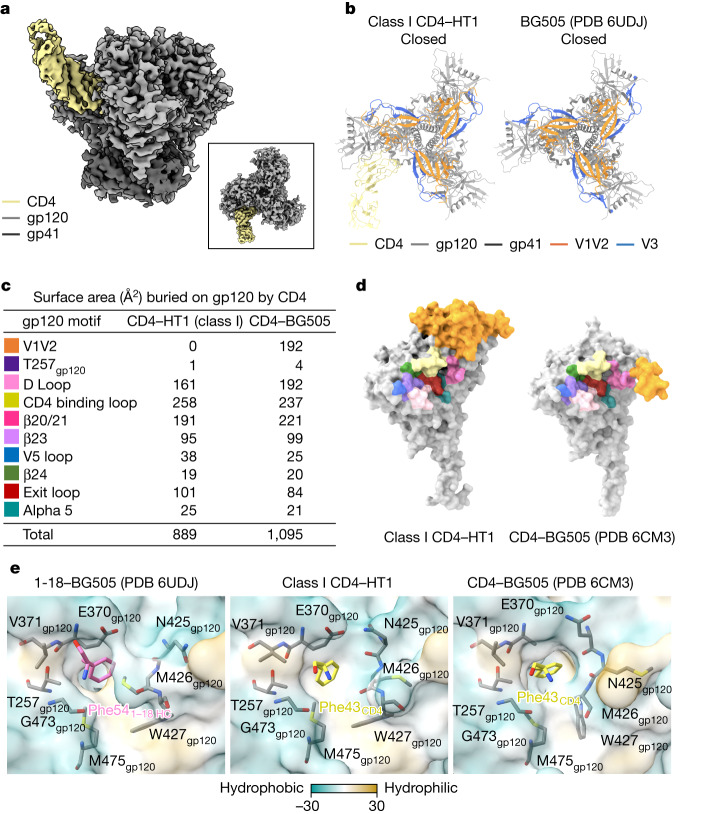
Fig. 1. 3.4 Å cryo-EM structure of BG505 HT1 bound to one CD4 shows closed, prefusion Env conformation.
a, Side view of the 3.4 Å class I CD4–HT1 density map. Inset, top-down view. b, Top-down cartoon representations of class I CD4–HT1 and BG505 (PDB 6UDJ; 1-18 and 10-1074 antibodies are not shown) structures with gp120 V1V2 and V3 loops highlighted. c, Table summarizing BSA on gp120 from CD4 binding for class I CD4–HT1 and CD4–BG505 (PDB 6CM3) complexes. d, Surface representation comparisons of class I CD4–HT1 and CD4–BG505 (PDB 6CM3). e, Surface representations depicting hydrophobicity (Kyte–Doolittle scale49) for 1-18–BG505 (PDB 6UDJ), class I CD4–HT1 and CD4–BG505 (PDB 6CM3) overlaid with stick representations of gp120 residues within the Phe43 cavity.

